Chart Patterns Introduction to the RSI Indicator
In the world of technical analysis, traders rely on a variety of tools to understand market behavior and make informed trading decisions. Among the many indicators available, the Relative Strength Index (RSI) stands out as one of the most trusted and widely used momentum indicators. Whether you are a beginner learning the basics of chart analysis or an experienced trader looking for high-probability trade setups, the RSI indicator can help you identify market momentum, detect potential reversals, and improve the timing of your entries and exits.
Financial markets are driven by two powerful emotions— fear and greed. During strong uptrends, investors become increasingly optimistic, often pushing prices to unsustainable levels. Conversely, during sharp declines, panic selling can drive prices far below their intrinsic value. The RSI indicator was developed to measure these emotional extremes by analyzing the speed and magnitude of recent price movements.
Unlike many technical indicators that focus only on trend direction, the RSI provides insight into market momentum. It answers important questions such as:
- Is the current trend still strong?
- Has the buying pressure become excessive?
- Are sellers beginning to lose control?
- Is the market preparing for a reversal?
By answering these questions, RSI enables traders to make more informed decisions instead of relying solely on emotions or market rumors.
The popularity of the RSI indicator comes from its versatility. It works effectively across multiple financial markets, including:
- Stocks
- Forex
- Cryptocurrencies
- Commodities
- Indices
- ETFs
It is equally useful for different trading styles such as intraday trading, swing trading, positional investing, and even long-term investing.
However, one of the biggest misconceptions among beginners is believing that RSI alone can predict the market. This is not true. Professional traders rarely depend on a single indicator. Instead, they combine RSI with price action, candlestick patterns, support and resistance levels, volume analysis, and other technical tools to improve the probability of successful trades.
This comprehensive guide will help you understand not only how the RSI indicator works but also how professional traders use it in real market conditions. By the end of this article, you will know how to identify high-quality trading opportunities, avoid common mistakes, and use RSI as part of a disciplined trading strategy.
What is the RSI Indicator?
The Relative Strength Index (RSI) is a momentum oscillator that measures the speed and strength of recent price movements. It helps traders determine whether an asset is gaining momentum, losing momentum, or approaching a potential reversal.
Developed by renowned technical analyst J. Welles Wilder Jr., RSI compares recent gains with recent losses over a specified period and converts the result into a value ranging from 0 to 100.
Unlike moving averages, which primarily indicate trend direction, RSI focuses on the strength of price momentum. This makes it especially useful for identifying situations where buying or selling pressure may be reaching an extreme.
The default RSI setting uses 14 periods, which means the indicator calculates the average gains and losses over the previous fourteen candles. Although traders can adjust this period according to their trading style, the 14-period setting remains the industry standard because it provides a balanced view of momentum without generating excessive noise.
Key RSI Levels
Understanding RSI levels is the first step toward using the indicator effectively.
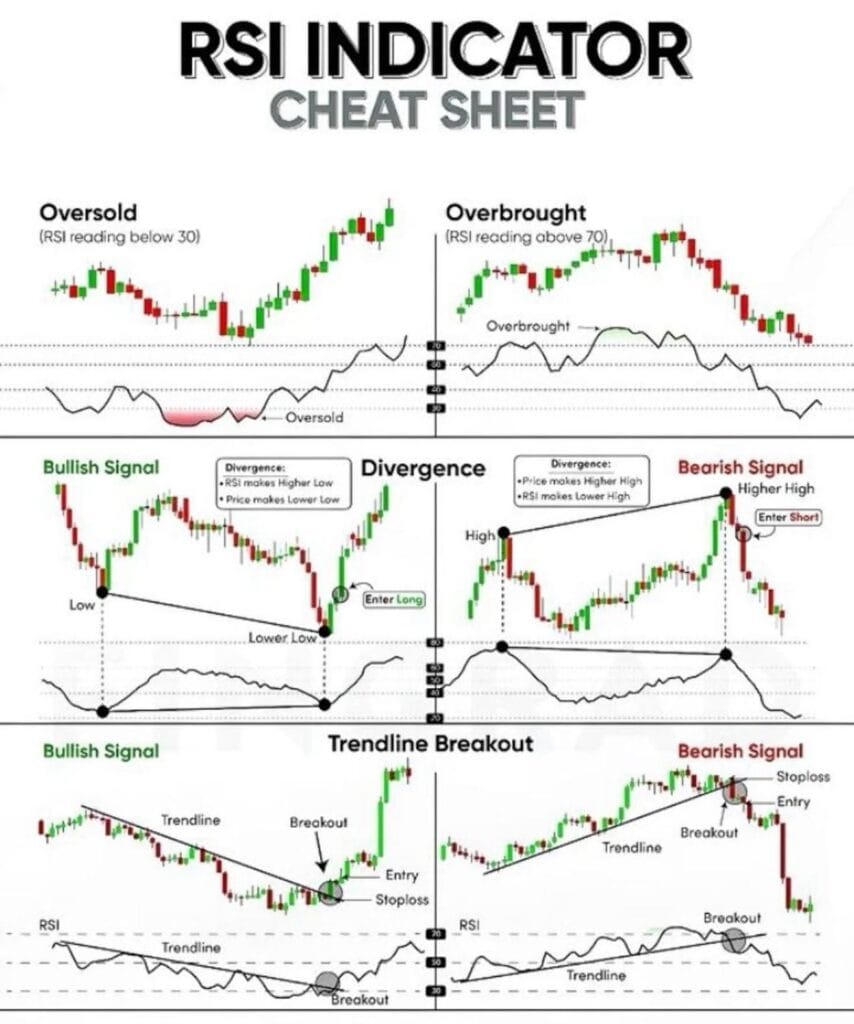
An RSI above 70 often suggests that an asset has experienced strong buying pressure and may be entering an overbought zone.
An RSI below 30 indicates that selling pressure has been significant and the asset may be approaching an oversold condition.
An RSI of around 50 represents a relatively balanced market where neither buyers nor sellers have a clear advantage.
It is important to understand that these levels should not be interpreted as automatic buy or sell signals. An asset can remain overbought during a powerful uptrend or oversold during a strong downtrend for an extended period. Therefore, experienced traders always seek confirmation before taking action.
Why Traders Use RSI
The RSI indicator serves multiple purposes in technical analysis, making it one of the most versatile tools available.
Traders use RSI to:
- Measure market momentum.
- Identify overbought and oversold conditions.
- Detect potential trend reversals.
- Confirm the strength of existing trends.
- Spot bullish and bearish divergences. Improve trade timing.
- Reduce emotional decision-making.
Because RSI reacts to changes in momentum before price trends fully reverse, it often provides early warning signals that help traders prepare for possible market movements.
Practical Example
Imagine that a stock has been rising steadily for several weeks. News headlines are overwhelmingly positive, and investor sentiment is extremely optimistic. As the stock continues climbing, the RSI also rises and eventually crosses above 70.
A beginner might immediately assume that the stock will fall simply because it is overbought.
A professional trader takes a different approach. Instead of selling immediately, they look for additional confirmation, such as:
- A bearish candlestick pattern.
- A resistance level.
- Declining trading volume.
- A bearish RSI divergence.
Only after confirming multiple signals do they consider entering a short position.
Similarly, if a stock falls sharply and RSI drops below 30, experienced traders wait for evidence that buyers are returning before entering a long trade.
This disciplined approach significantly improves trading accuracy and reduces false signals.
History of the RSI Indicator and J. Welles Wilder Jr.
The Relative Strength Index was introduced in 1978 by J. Welles Wilder Jr. in his landmark book, New Concepts in Technical Trading Systems. This book revolutionized technical analysis by introducing several indicators that remain widely used today.
Wilder believed that understanding momentum was just as important as understanding price direction. Markets rarely move in straight lines. Instead, they alternate between periods of strong momentum, consolidation, and reversal. His goal was to create an indicator capable of measuring these shifts objectively.
In addition to RSI, Wilder developed several influential tools, including:
- Average True Range (ATR)
- Average Directional Index (ADX)
- Parabolic SAR
These indicators continue to play an important role in modern trading platforms such as TradingView, MetaTrader, and Thinkorswim.
When Wilder introduced RSI, chart analysis was largely performed manually. Traders calculated indicator values using printed price data and calculators. Today, every major trading platform calculates RSI instantly, allowing traders to focus on analysis rather than mathematics.
More than four decades after its introduction, RSI remains one of the most respected momentum indicators in technical analysis. Its longevity is a testament to its effectiveness across changing market conditions and asset classes.
Rather than replacing human judgment, RSI serves as a decision-support tool. When combined with proper risk management and disciplined trading, it can become an invaluable part of a trader’s toolkit.
In the next section, we will explore how the RSI indicator works, understand the mathematics behind its calculation in simple language, and learn why it reacts the way it does during different market conditions.
How Does the RSI Indicator Work?
Understanding how the Relative Strength Index (RSI) works is essential before using it in live trading. Many beginners simply memorize that an RSI above 70 means overbought and an RSI below 30 means oversold. While these levels are useful, they represent only a small part of what the RSI indicator actually tells you.
At its core, RSI measures the strength and speed of recent price movements, also known as momentum. Instead of focusing on whether the market is going up or down, RSI evaluates how strongly buyers or sellers are controlling the market.
Imagine two different stocks:
Stock A rises slowly by 1% every day for two weeks.
Stock B jumps 12% in just three days.
Although both stocks are moving upward, Stock B has much stronger bullish momentum. The RSI captures this difference by comparing recent gains with recent losses.
This is why RSI is called a momentum oscillator rather than a trend indicator.
The Logic Behind RSI
Every trading day consists of a battle between buyers and sellers.
- If buyers dominate, prices close higher.
- If sellers dominate, prices close lower.
- If neither side gains control, prices remain relatively stable.
The RSI tracks this battle over a selected period—usually 14 candles —to determine which side currently has more strength.
Think of RSI as a momentum meter.
Instead of asking:
“Is the market going up?”
It asks:
“How strong is the current move?”
This distinction makes RSI extremely valuable because momentum often changes **before** price direction changes.
Understanding RSI with an Example
Suppose a stock moves like this over 14 days:
Day Price Movement
1 +2%
2 +1.5%
3 +1%
4 +3%
5 +0.5%
6 +2%
7 -0.4%
8 +1.8%
9 +2%
10 +1.3%
11 +0.8%
12 +2.4%
13 +1.5%
14 +1.1% |
Notice something?
Most days closed positively.
The buying pressure is much stronger than the selling pressure.
As a result, the RSI value will probably rise above 70, indicating that buyers have been dominating recently.
Now imagine the opposite situation.
Most candles close lower.
Selling pressure increases every day.
The RSI gradually falls below 30, showing that bears have taken control.
Why RSI Moves Between 0 and 100
Unlike moving averages, the RSI never keeps rising forever.
Its value always remains between 0 and 100, making it one of the easiest technical indicators to interpret.
RSI Value Interpretation
0 – Extremely Weak Momentum
20 – Very Strong Selling Pressure
30 – Oversold Zone
50 – Neutral Market Momentum
70 – Overbought Zone
80 – Extremely Strong Buying Pressure
100 – Maximum Possible Momentum
In real market conditions, the RSI rarely reaches the extreme values of 0 or 100 because prices constantly fluctuate as buyers and sellers compete for control.
RSI Formula (Explained Simply)
Many beginners feel intimidated when they see mathematical formulas. Fortunately, you do not need to calculate the Relative Strength Index (RSI) manually because modern trading platforms such as TradingView, MetaTrader, and other charting software automatically perform the calculation in real time.
However, understanding the basic formula can help you better understand how the RSI reacts to changing market conditions.
RSI Formula
RSI = 100 − [100 ÷ (1 + RS)]
Where:
RS (Relative Strength) = Average Gain ÷ Average Loss
Although the formula may appear complex at first, its concept is quite simple. The RSI compares the average price gains with the average price losses over a selected period, usually 14 candles.
If the average gains are greater than the average losses, the RSI value rises, indicating increasing bullish momentum. Conversely, if the average losses exceed the average gains, the RSI value falls, indicating strengthening bearish momentum.
In simple terms, the RSI measures whether buyers or sellers have been stronger during the selected time period, making it an effective tool for evaluating market momentum.
A Simple Analogy
Imagine two cricket teams.
Team Buyers scores 280 runs.
Team Sellers scores 120 runs.
Clearly, Team Buyers performed much better.
RSI reflects this difference by moving toward the higher end of its scale.
Now imagine:
Team Buyers scores 110 runs.
Team Sellers scores 275 runs.
Now sellers dominate, and RSI drops toward the lower end.
The greater the difference between buyers and sellers, the further RSI moves away from 50.
Why the Default Setting is 14
When J. Welles Wilder created RSI, he selected 14 periods because it provided a balanced view of market momentum.
Today, the 14-period RSI remains the industry standard because it works well across:
Stocks
Forex
Cryptocurrency
Commodities
Indices
However, traders often customize the setting depending on their strategy.
Shorter RSI (5–9)
A shorter RSI reacts much faster to price changes.
Advantages:
Early signals
Suitable for scalping
Better for intraday trading
Disadvantages:
More false signals
Higher market noise
Standard RSI (14)
Advantages:
Balanced performance
Reliable momentum measurement
Most widely used
Suitable for:
Swing trading
Position trading
General technical analysis
Longer RSI (21–30)
Advantages:
Filters market noise
Produces stronger signals
Disadvantages:
Signals arrive later
Suitable for:
Long-term investing
Weekly charts
Trend-following strategies
How to Add RSI on TradingView
TradingView makes it very easy to use the RSI indicator.
Step 1
Open your preferred chart on TradingView.
Choose any market such as:
Stocks
Crypto
Forex
Commodities
Step 2
Click the Indicators button located at the top of the chart.
Step 3
Search for:
Relative Strength Index
Step 4
Click the built-in RSI developed by TradingView.
The indicator immediately appears below your price chart.
Step 5
Click the Settings icon to customize:
RSI Length
Source (usually Close Price)
Upper Level
Lower Level
Colors
Style
Most traders leave the default settings unchanged.
Understanding RSI Levels
One of the biggest strengths of RSI is its standardized scale.
Let’s understand each important level.
RSI Below 20
This represents extremely strong selling pressure.
Markets rarely stay below 20 for long.
However, remember:
A very strong downtrend can remain below 20 longer than expected.
Professional traders wait for confirmation before buying.
RSI Below 30
This is the famous Oversold Zone.
It suggests sellers have dominated recent trading sessions.
Possible interpretation:
Selling momentum may slow.
Buyers could return.
A reversal becomes possible.
Notice the word possible.
It is not guaranteed.
RSI Around 50
This represents a neutral market.
Neither buyers nor sellers have a major advantage.
Many professional traders use 50 as a trend filter.
Above 50:
Bullish momentum.
Below 50:
Bearish momentum.
RSI Above 70
This is known as the Overbought Zone.
Buying pressure has become very strong.
This does not automatically mean prices will fall.
In powerful bull markets, RSI can remain above 70 for several weeks.
Professional traders combine this reading with:
Resistance
Volume
Divergence
before taking action.
RSI Above 80
Above 80 indicates extreme bullish momentum.
Momentum is exceptionally strong.
This often occurs during:
- Breakouts
- Earnings rallies
- Strong crypto bull runs
- Trending markets
Although corrections become more likely, strong trends can remain above 80 much longer than beginners expect.
Why Beginners Misuse RSI
One of the biggest mistakes new traders make is assuming:
RSI above 70 = Sell immediately.
or
RSI below 30 = Buy immediately.
Professional traders know this approach often fails.
Instead, they ask:
- Is the market trending?
- Is there support or resistance?
- Is volume confirming?
- Is there divergence?
- Is price forming a reversal pattern?
Only when multiple factors align do they enter a trade.
This multi-confirmation approach dramatically improves the probability of success.
In the next section, we will explore Overbought vs. Oversold conditions, followed by Bullish RSI Signals, Bearish RSI Signals, and RSI Divergence, which are among the most powerful applications of the RSI indicator.
Overbought vs Oversold: Understanding RSI Market Conditions
One of the primary reasons traders use the Relative Strength Index (RSI) is to identify overbought and oversold market conditions. These two concepts help traders understand whether the current price movement has become unusually strong and whether a potential reversal or price correction could occur.
However, one of the biggest mistakes beginners make is assuming that an overbought market must immediately fall or that an oversold market must immediately rise. In reality, RSI should be viewed as a warning indicator, not a direct buy or sell signal.
Professional traders always combine RSI readings with price action, support and resistance levels, candlestick patterns, and volume analysis before making trading decisions.
What Does Overbought Mean?
An asset is considered overbought when buying pressure has pushed the RSI above 70. This suggests that buyers have been dominating the market for a considerable period, causing prices to rise rapidly.
An overbought reading does not mean the asset is overpriced or that it must fall immediately. Instead, it indicates that the upward momentum has become very strong and may eventually slow down.
Characteristics of an Overbought Market
- RSI moves above 70.
- Price has been rising consistently.
- Buying momentum is very strong.
- Market sentiment is highly optimistic.
- Traders may begin booking profits.
Example of an Overbought Market
Imagine a company’s stock trading at ₹800. After announcing better-than-expected quarterly earnings, the stock rallies to ₹950 within a few days. During this rally, the RSI climbs from 48 to 76.
At this point, the market is considered overbought.
Does this guarantee the stock will fall tomorrow?
No.
The stock may continue climbing to ₹980 or even ₹1,000 if buying pressure remains strong. The RSI is simply warning traders that momentum has become unusually strong and a correction is becoming more likely.
Professional traders wait for additional confirmation, such as:
- A Bearish Engulfing pattern
- Shooting Star candle
- Resistance level
- Bearish RSI divergence
- Declining volume
Only after confirmation do they consider entering a sell trade.
What Does Oversold Mean?
An asset is considered oversold when the RSI falls below 30. This indicates that sellers have dominated recent trading sessions and the asset has experienced significant downward momentum.
Like overbought conditions, an oversold reading is not an automatic buy signal.
Instead, it tells traders that selling pressure has become excessive and buyers may soon return.
Characteristics of an Oversold Market
- RSI falls below 30.
- Price has declined sharply.
- Selling momentum is very strong.
- Fear dominates market sentiment.
- Buyers may begin accumulating positions.
Example of an Oversold Market
Suppose Bitcoin falls from $75,000 to $63,000 within two weeks due to negative market news.
During this decline, the RSI drops to 24.
Many beginners immediately buy because RSI is below 30.
Professional traders wait.
They first ask:
- Is price near a major support level?
- Is buying volume increasing?
- Is there a bullish candlestick pattern?
- Is RSI showing bullish divergence?
If these confirmations appear, the probability of a successful trade increases significantly.
Why Overbought Doesn’t Always Mean Sell
This is one of the most misunderstood concepts in technical analysis.
Strong bull markets often remain overbought for extended periods.
For example:
A stock breaks above a major resistance level.
Institutional investors begin buying aggressively.
The RSI reaches 75.
Instead of falling, the stock continues rising another 20%.
Why?
Because momentum remains extremely strong.
Selling solely because RSI crossed 70 could cause traders to miss substantial profits.
Why Oversold Doesn’t Always Mean Buy
The opposite is equally true.
Strong bear markets often remain oversold for weeks.
Suppose a company announces poor financial results.
The stock falls every day.
RSI remains below 30 for nearly two weeks.
Buying simply because RSI is oversold may lead to further losses.
Professional traders always wait for evidence that sellers are losing control before entering a trade.
Comparing Overbought and Oversold Conditions
| Overbought | Oversold |
|---|---|
| RSI Above 70 | RSI Below 30 |
| Strong Buying Pressure | Strong Selling Pressure |
| Bullish Momentum | Bearish Momentum |
| Possible Price Correction | Possible Price Recovery |
| Watch for Sell Confirmation | Watch for Buy Confirmation |
Bullish RSI Signals
Although RSI is famous for identifying overbought and oversold conditions, it offers several other bullish signals that professional traders rely on.
1. RSI Crossing Above 30
After remaining below 30, RSI moving back above this level often suggests that selling momentum is weakening.
This does not confirm a new uptrend, but it indicates buyers are beginning to regain control.
Professional traders look for additional confirmation before entering.
2. RSI Crossing Above 50
Many experienced traders consider the 50 level more important than the 30 level.
When RSI moves above 50:
- Buying momentum exceeds selling momentum.
- Trend strength improves.
- Bulls begin dominating the market.
Many swing traders use RSI above 50 as confirmation of bullish strength.
3. Bullish Divergence
Bullish divergence occurs when:
- Price makes a lower low.
- RSI makes a higher low.
This indicates that although prices continue falling, selling momentum is weakening.
This often appears before major market reversals.
Example:
Price:
950 → 900 → 860
RSI:
28 → 31
Although the price reached a new low, RSI failed to do so.
This suggests sellers are losing momentum.
4. Bullish Failure Swing
A bullish failure swing occurs when RSI:
- Falls below 30.
- Moves above 30.
- Pulls back without making a new RSI low.
- Breaks above its previous high.
This pattern often signals a strong bullish reversal.
Bearish RSI Signals
Professional traders also use RSI to identify bearish opportunities.
1. RSI Falling Below 70
After remaining above 70, RSI moving back below this level may indicate weakening buying momentum.
However, confirmation remains essential.
2. RSI Falling Below 50
This suggests:
- Selling pressure exceeds buying pressure.
- Momentum is becoming bearish.
- Downtrend probability increases.
Many traders use this level to confirm bearish market conditions.
3. Bearish Divergence
Bearish divergence forms when:
- Price makes a higher high.
- RSI makes a lower high.
Although prices continue rising, momentum is weakening.
This often warns traders that buyers are losing strength.
Example:
Price:
500 → 540 → 570
RSI:
82 → 74
Price reached a new high.
RSI did not.
Momentum weakened.
This increases the probability of a correction.
4. Bearish Failure Swing
A bearish failure swing occurs when RSI:
- Moves above 70.
- Falls below 70.
- Rises again but fails to make a new RSI high.
- Breaks below the previous low.
This pattern often precedes significant downward movements.
When Should You Trust RSI Signals?
Professional traders rarely trust RSI alone.
Instead, they combine RSI with:
- Support and resistance
- Trendlines
- Volume analysis
- Moving averages
- MACD
- Candlestick patterns
- Chart patterns
The more confirmations you have, the stronger the trading setup becomes.
Key Takeaways
- RSI above 70 indicates strong buying momentum, but is not an automatic sell signal.
- An RSI below 30 indicates strong selling momentum, but it is not an automatic buy signal.
- Bullish RSI signals help identify improving buying pressure.
- Bearish RSI signals warn of weakening momentum.
- Confirmation from price action is essential before entering any trade.
In the next section, we will explore RSI Divergence (Bullish & Bearish), Hidden Divergence, and RSI Failure Swings in detail with practical examples used by professional traders.