The Evening Star Candlestick Pattern is one of the most reliable bearish reversal patterns in technical analysis. It signals that buyers are losing momentum and sellers are beginning to take control. Whether you trade stocks, forex, or cryptocurrencies, recognizing this pattern can help you avoid buying near market tops and identify profitable short-selling opportunities.
In this guide, you’ll learn how the Evening Star pattern forms, why it works, how to trade it, and common mistakes to avoid.
What Is the Evening Star Candlestick Pattern?
The Evening Star is a three-candle bearish reversal pattern that appears after an uptrend. It indicates that bullish momentum is weakening and a downward reversal may soon begin.
It is considered one of the strongest bearish candlestick patterns because it clearly shows the shift in market sentiment from buyers to sellers.
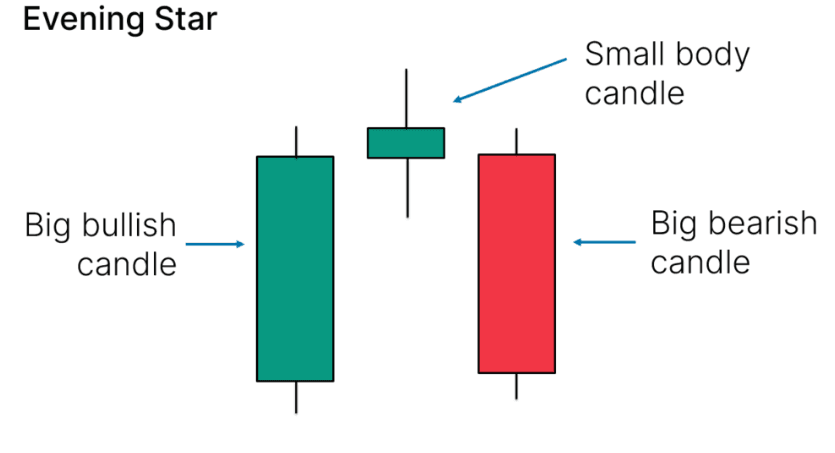
The pattern consists of three candles:
1. First Candle – Strong Bullish Candle
- Large green candle
- Buyers dominate the market.
- Confirms an existing uptrend.
2. Second Candle – Small Body
- Small bullish, bearish, or Doji candle
- Indicates market indecision.
- Buying momentum starts weakening.
3. Third Candle – Strong Bearish Candle
- Large red candle
- Closes well into the body of the first candle.
- Confirms that sellers have taken control.
Psychology Behind the Pattern
Understanding the psychology makes this pattern easier to remember.
Step 1
Buyers remain confident and continue pushing prices higher.
Step 2
The market loses momentum. Neither buyers nor sellers have complete control.
Step 3
Sellers enter aggressively, overwhelming buyers and triggering a bearish reversal.
This transition from optimism to uncertainty and finally to fear creates the Evening Star pattern.
How to Identify an Evening Star
Look for these conditions:
- Existing uptrend
- Strong bullish first candle
- Small second candle
- Large bearish third candle
- The third candle closes deep inside the first candle
- Higher trading volume on the third candle adds confirmation
How to Trade the Evening Star Pattern
Entry
Enter a sell trade after the third bearish candle closes or on the break below its low.
Stop Loss
Place the stop loss above the high of the second candle or above the highest point of the pattern.
Target
Use:
- Previous support levels
- Risk-to-reward ratio of at least 1:2
- Trailing stop in strong downtrends
Best Confirmation Indicators
The Evening Star becomes more reliable when combined with:
- RSI is showing overbought conditions
- MACD bearish crossover
- Resistance zones
- Trendlines
- Moving averages
- High trading volume
- Bearish divergence
Advantages
- Easy to identify
- High probability reversal signal
- Works across multiple timeframes
- Suitable for stocks, forex, commodities, and crypto
- Excellent when combined with support and resistance
Limitations
- Can produce false signals in sideways markets
- Needs confirmation before entering trades
- Less reliable during strong bullish trends
- Better when combined with other technical indicators
Common Mistakes
- Trading without confirmation
- Ignoring the overall market trend
- Placing stop losses too close
- Trading on very low-volume charts
- Using the pattern alone without technical analysis
Example
Imagine a stock rising from 500 to 560.
Day 1: Strong bullish candle closes at 560.
Day 2: Small Doji forms near 562.
Day 3: Strong bearish candle closes at 545.
This indicates buyers have lost control, and the stock may begin a downward trend.
Is the Evening Star Reliable?
Yes, but no candlestick pattern is 100% accurate.
The Evening Star performs best when:
- It appears after a strong uptrend.
- It forms near resistance.
- It is confirmed by high volume.
- Technical indicators support the reversal.
Professional traders rarely rely on the pattern alone—they combine it with trend analysis and risk management.
Head and Shoulders Pattern with Evening Star Entry Strategy
Introduction
The Head and Shoulders Pattern with an Evening Star entry is a high-probability bearish trading strategy that combines a classic chart pattern with a powerful candlestick reversal signal. While the Head and Shoulders pattern indicates that an uptrend may be ending, the Evening Star provides early confirmation that sellers are taking control. Using both together helps traders avoid false breakouts and improve trade accuracy.
What Is the Strategy?
This strategy combines two well-known technical analysis tools:
- Head and Shoulders Pattern – A bearish reversal chart pattern that forms after an uptrend.
- Evening Star Candlestick Pattern – A three-candle bearish reversal pattern that confirms selling pressure.
Instead of entering immediately after the Head and Shoulders pattern forms, traders wait for an Evening Star to appear near the right shoulder. This additional confirmation increases the probability of a successful trade.
How the Pattern Forms
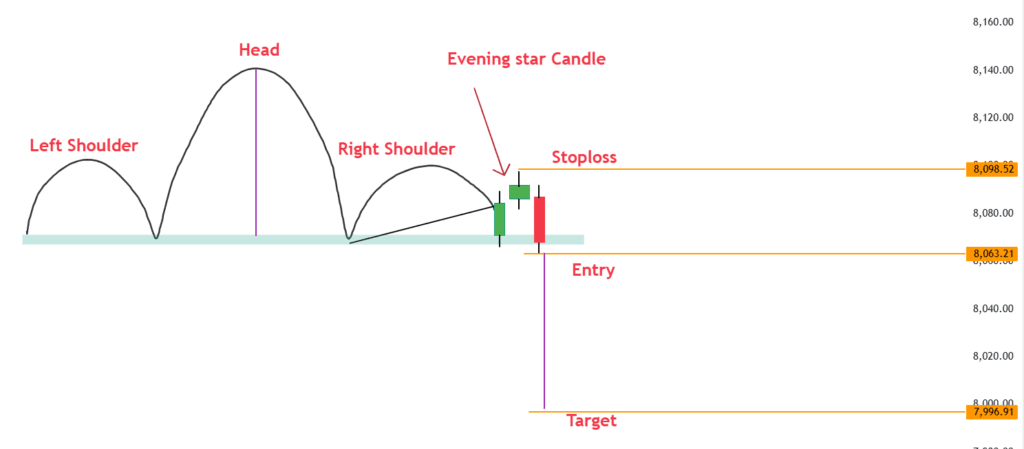
Step 1: Left Shoulder
The market makes a new high before experiencing a temporary pullback.
Step 2: Head
Price rallies again and creates a higher high than the left shoulder. Buyers still appear strong, but momentum begins to weaken.
Step 3: Right Shoulder
The market attempts another rally but fails to make a new high. This lower high signals that buyers are losing strength.
Step 4: Evening Star Appears
An Evening Star candlestick pattern forms at or near the top of the right shoulder. This shows that buying momentum has faded and sellers are beginning to dominate.
Step 5: Neckline Break
Price breaks below the neckline, confirming the bearish reversal and providing a sell opportunity.
Entry Rules
Sell Entry
Enter a short trade when:
- The Evening Star pattern is fully completed.
- Price breaks below the low of the third (bearish) candle.
- Ideally, the neckline is also broken for stronger confirmation.
Stop-Loss Placement
Place the stop-loss:
- Above the high of the Evening Star pattern, or
- Above the right shoulder high.
This protects the trade if the bearish setup fails.
Profit Target
Targets can be set using:
- The measured move from the Head to the Neckline, projected downward.
- Previous support zones.
- A minimum Risk-to-Reward ratio of 1:2 or higher.
Why This Strategy Works
The strategy combines two independent bearish signals:
- The Head and Shoulders pattern signals a possible trend reversal.
- The Evening Star confirms that sellers have entered the market.
- The Neckline breakdown provides final confirmation before entering the trade.
Using multiple confirmations reduces false signals and improves trading confidence.
Best Confirmation Indicators
For better accuracy, combine this strategy with:
- RSI above 70 followed by a bearish reversal
- MACD bearish crossover
- Declining buying volume at the right shoulder
- Strong resistance zone
- Bearish divergence
- Higher time-frame trend analysis
Advantages
- High-probability bearish setup
- Multiple confirmations reduce false entries
- Clear entry, stop-loss, and target levels
- Works well in stocks, forex, indices, and cryptocurrencies
- Suitable for swing trading and intraday trading
Common Mistakes
- Entering before the Evening Star completes
- Ignoring the neckline confirmation
- Trading against the higher-timeframe trend
- Placing the stop-loss too close
- Ignoring volume confirmation
Practical Example
Suppose a stock has been in a strong uptrend and forms a Head and Shoulders pattern.
- The left shoulder forms at 500.
- The head reaches 540.
- The right shoulder forms near 520.
- An Evening Star appears at the top of the right shoulder.
- Price breaks below the neckline at 495.
Trade Setup:
- Entry: Sell below 495 after the Evening Star confirmation.
- Stop-Loss: Above 520 (right shoulder high).
- Target: Measure the distance from the head (540) to the neckline (495), which is 45. Project 45 below the neckline for a target near 450.
Conclusion
The Head and Shoulders Pattern with an Evening Star Entry is a powerful bearish trading strategy because it combines chart structure with candlestick confirmation. Rather than entering solely on the chart pattern, waiting for an Evening Star at the right shoulder provides stronger evidence that buyers have lost control. When combined with a neckline break, proper risk management, and confirmation indicators such as RSI and MACD, this strategy can significantly improve the quality of bearish trade setups.
Double Top Pattern with Evening Star Candle Strategy
Introduction
The Double Top Pattern with an Evening Star Candle is a powerful bearish trading strategy used to identify potential trend reversals after a strong uptrend. The Double Top pattern signals that buyers have failed to push prices above a key resistance level twice, while the Evening Star candlestick confirms that selling pressure is increasing. Combining these two patterns provides traders with a high-probability sell setup and helps reduce false trading signals.
What Is the Double Top Pattern?
A Double Top is a bearish reversal chart pattern that forms after a prolonged uptrend. It consists of two nearly equal highs separated by a temporary pullback. The pattern indicates that buyers have attempted to break the same resistance level twice but failed, suggesting that bullish momentum is weakening.
The support level between the two peaks is known as the neckline. A break below this neckline confirms the bearish reversal.
What Is the Evening Star Candle?
The Evening Star is a three-candle bearish reversal pattern consisting of:
1. Strong Bullish Candle
A large green candle showing strong buying momentum.
2. Small Body Candle
A small bullish, bearish, or Doji candle indicates market indecision.
3. Strong Bearish Candle
A large red candle that closes well into the first candle’s body, confirming that sellers have taken control.
When this pattern forms near the second top of a Double Top, it provides an early confirmation that the market is likely to reverse.
How the Strategy Works
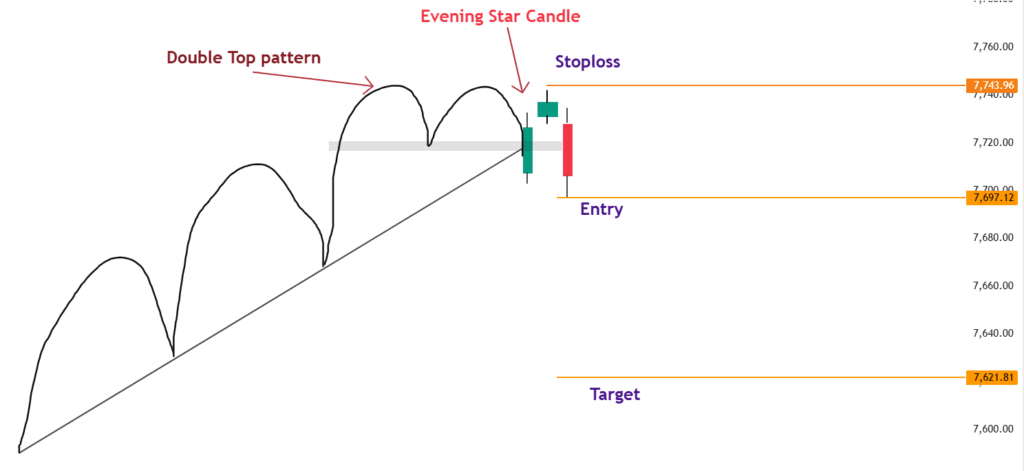
Step 1 – Strong Uptrend
The market is making higher highs and higher lows, showing bullish momentum.
Step 2 – First Top Forms
Price reaches a resistance level and pulls back.
Step 3 – Second Top Forms
Price rallies again but fails to break above the previous high, creating the second top.
Step 4 – Evening Star Appears
An Evening Star candlestick pattern forms at the second top, indicating that buyers are losing control and sellers are becoming dominant.
Step 5 – Neckline Break
Price breaks below the neckline, confirming the Double Top pattern and providing a high-probability sell signal.
Entry Rules
Enter a sell trade when:
- The Evening Star pattern is fully completed.
- Price breaks below the low of the third bearish candle.
- The neckline is broken with strong bearish momentum.
- Volume increases during the breakdown for additional confirmation.
Stop-Loss Placement
Place your stop-loss:
- Above the high of the Evening Star pattern.
- Or slightly above the second top.
This protects the trade if the market resumes its uptrend.
Profit Target
You can set your target using:
- The measured move from the Top to the Neckline is projected downward.
- Previous support zones.
- A minimum Risk-to-Reward ratio of 1:2.
Why This Strategy Works
This strategy combines two strong bearish signals:
- The Double Top shows buyers failed to break resistance twice.
- The Evening Star confirms a shift from buying pressure to selling pressure.
- The Neckline breakdown confirms the reversal and triggers the sell entry.
Using multiple confirmations improves trade accuracy and reduces false breakouts.
Best Confirmation Indicators
For higher accuracy, combine this strategy with:
- RSI above 70 (Overbought)
- MACD bearish crossover
- Declining volume on the second top
- Strong resistance zone
- Bearish divergence
- Higher timeframe trend analysis
Advantages
- High-probability bearish reversal strategy
- Easy to identify on price charts
- Clear entry, stop-loss, and target levels
- Works in stocks, forex, crypto, commodities, and indices
- Suitable for both swing trading and intraday trading
Common Mistakes
- Entering before the Evening Star completes
- Ignoring neckline confirmation
- Trading in sideways markets
- Placing the stop-loss too close
- Ignoring volume and momentum indicators
Practical Example
Suppose a stock rallies from 800 to 950 and forms its first top.
- The stock pulls back to 920, creating the neckline.
- Buyers attempt another rally, but the price again reaches only 950, forming the second top.
- An Evening Star appears at the second top, showing strong selling pressure.
- Price then breaks below the neckline at 920, confirming the Double Top.
Trade Setup:
- Sell Entry: Below 920 after the Evening Star confirmation.
- Stop-Loss: Above 950.
- Target: Measure the distance from 950 to 920 (30) and project it below the neckline, giving a target of approximately 890.
Conclusion
The Double Top Pattern with an Evening Star Candle is one of the most reliable bearish reversal strategies because it combines a proven chart pattern with a strong candlestick confirmation. The Double Top warns that buyers have failed to break resistance, while the Evening Star confirms that sellers are taking control. Waiting for both signals before entering a trade helps reduce false entries and improve overall trading performance.
For the best results, always combine this strategy with volume analysis, RSI, MACD, support and resistance levels, and proper risk management.
Frequently Asked Questions (FAQs)
Is the Double Top pattern bullish or bearish?
It is a bearish reversal pattern.
Where should the Evening Star form?
Ideally, it should form near the second top or resistance level.
When should I enter the trade?
After the Evening Star is completed and the price breaks below the neckline or the low of the third bearish candle.
Which timeframe works best?
The strategy works on all timeframes, but 1-hour, 4-hour, daily, and weekly charts generally provide stronger signals.
Which indicators work best with this strategy?
RSI, MACD, volume analysis, support and resistance, and bearish divergence provide excellent confirmation.
Is the Evening Star pattern bullish or bearish?
It is a bearish reversal pattern.
How many candles make an Evening Star?
Three candles.
Which timeframe is best?
It works on all timeframes, but 1-hour, 4-hour, daily, and weekly charts generally provide stronger signals.
Can beginners use this pattern?
Yes. It is one of the easiest bearish reversal patterns to identify.
Which indicator works best with the Evening Star?
RSI, MACD, moving averages, support and resistance, and volume analysis are commonly used for confirmation.