
Introduction
Imagine squeezing a spring between your hands. As you apply pressure, the spring stores energy until it suddenly releases with force. Financial markets often behave in the same way.
During a Wedge Pattern, price movements gradually become smaller as buyers and sellers battle for control. The market appears calm, but beneath the surface, momentum is building. Eventually, one side overpowers the other, causing a strong breakout that can lead to a significant price move.
This is why the Wedge Pattern is considered one of the most valuable chart patterns in technical analysis. Professional traders use it to identify high-probability trading opportunities across stocks, forex, cryptocurrencies, commodities, and indices. Whether you’re a day trader, swing trader, or long-term investor, understanding this pattern can help you recognize potential trend reversals and continuation setups before they become obvious to everyone else.
However, many beginners make the mistake of trading every wedge they see. Not every wedge leads to a successful breakout, and entering too early often results in false signals and unnecessary losses.
In this comprehensive guide, you’ll learn everything you need to know about the Wedge Pattern—from its structure and market psychology to trading strategies, stop-loss placement, profit targets, and common mistakes to avoid. By the end of this article, you’ll understand not only how to identify a wedge but also why it forms and how experienced traders use it to make informed trading decisions.
What is a Wedge Pattern?
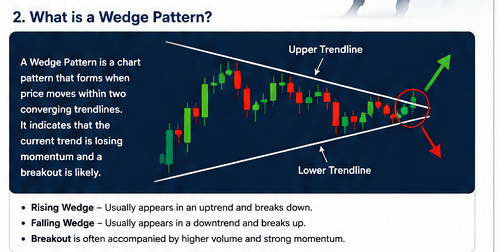
A Wedge Pattern is a chart pattern in technical analysis that forms when the price moves within two converging trendlines. As the price continues to fluctuate, the distance between the upper and lower trendlines gradually narrows, creating a wedge-shaped structure.
Unlike many other chart patterns, both trendlines in a wedge move in the same direction. They may slope upward or downward, but one trendline is steeper than the other. This gradual convergence indicates that the current trend is losing momentum, and the market is preparing for a breakout.
A wedge pattern can signal either a trend reversal or a trend continuation, depending on where it appears and the direction of the breakout. This flexibility makes it one of the most versatile tools in technical analysis.
For example:
- A Rising Wedge usually appears during an uptrend and often signals that buyers are losing momentum, increasing the likelihood of a bearish breakout.
- A Falling Wedge typically forms during a downtrend and suggests that selling pressure is weakening, increasing the chances of a bullish breakout.
Unlike random price movements, a wedge reflects the ongoing battle between buyers and sellers. As the price range becomes tighter, market participants become more cautious. Eventually, this period of consolidation ends with a breakout, often accompanied by a noticeable increase in trading volume.
Key Characteristics of a Wedge Pattern
A valid Wedge Pattern generally has the following characteristics:
- Two converging trendlines connecting swing highs and swing lows.
- Price remains confined within the trendlines until the breakout.
- Trading volume usually decreases as the pattern develops.
- Volatility contracts, resulting in smaller price swings.
- A breakout above or below the trendline confirms the pattern.
- The breakout is often accompanied by higher trading volume.
The cleaner and more symmetrical the wedge, the more reliable it tends to be. However, traders should always wait for confirmation instead of assuming that every wedge will lead to a profitable trade.
Why is it Called a Wedge Pattern?
The name “Wedge Pattern” comes from its distinctive shape on a price chart. As the market moves, the two trendlines gradually converge, forming a narrow triangular structure that closely resembles a construction wedge.
Unlike a Triangle Pattern, where one trendline may remain horizontal, both trendlines in a wedge slope in the same direction. This unique characteristic makes the pattern easy to identify once you understand its structure.
The narrowing price range also tells an important story about market behavior. As buyers and sellers continue to compete, neither side is able to create large price movements. Instead, each swing becomes smaller than the previous one, indicating that momentum is fading. This reduction in volatility often precedes a strong breakout.
Because the pattern visually resembles a wedge and represents a period of decreasing momentum before a significant move, traders around the world refer to it as the Wedge Pattern.
Types of Wedge Patterns
There are two main types of Wedge Patterns used in technical analysis. Although both have converging trendlines, they differ in their appearance, market psychology, and trading implications.
1. Rising Wedge Pattern (Bearish)
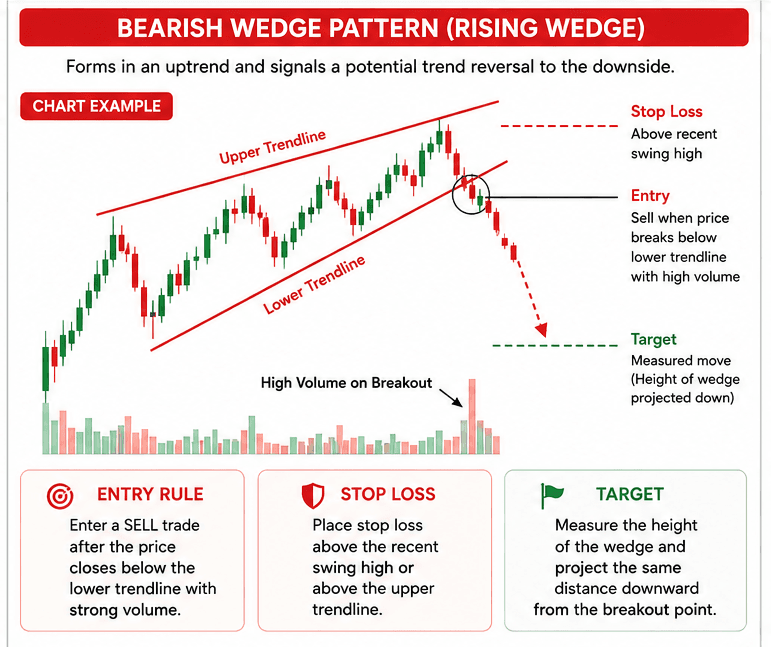
Trading view- https://www.tradingview.com/
A Rising Wedge Pattern forms when the price continues to make higher highs and higher lows, but the upward momentum gradually weakens. Both trendlines slope upward, with the lower trendline rising faster than the upper trendline.
At first glance, the market appears bullish because prices are still moving higher. However, a closer look reveals that buyers are struggling to maintain the same level of momentum. Each new rally becomes weaker, while sellers slowly begin entering the market.
Once the price breaks below the lower trendline with strong volume, the pattern is confirmed, and many traders interpret it as a bearish signal.
Common Characteristics
- Usually forms after a strong uptrend.
- Both trendlines slope upward.
- Buying momentum gradually weakens.
- Volume often declines during formation.
- Breakdown below the lower trendline confirms the pattern.
2. Falling Wedge Pattern (Bullish)
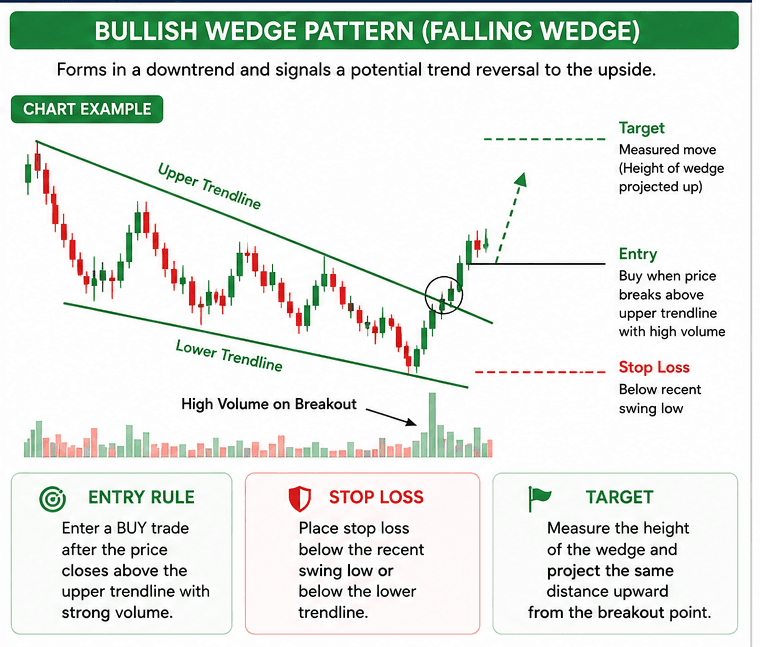
A Falling Wedge Pattern develops when the price continues making lower highs and lower lows, but the downward momentum starts slowing. Both trendlines slope downward, with the upper trendline falling faster than the lower one.
Although the market is still declining, sellers are losing control. Buyers gradually begin absorbing selling pressure, causing each downward move to become smaller than the previous one.
When the price breaks above the upper trendline with increased volume, it signals that buyers have regained control and a bullish move may begin.
Common Characteristics
- Usually forms after a downtrend.
- Both trendlines slope downward.
- Selling pressure gradually weakens.
- Trading volume decreases during formation.
- Breakout above the upper trendline confirms the bullish signal.
Rising Wedge vs Falling Wedge
| Feature | Rising Wedge | Falling Wedge |
|---|---|---|
| Market Bias | Bearish | Bullish |
| Trendline Direction | Upward | Downward |
| Common Breakout | Downward | Upward |
| Market Psychology | Buyers losing strength | Sellers losing strength |
| Typical Market | Uptrend | Downtrend |
Understanding the difference between these two patterns is essential because they often signal opposite trading opportunities. Correctly identifying whether the wedge is rising or falling helps traders choose the appropriate entry, stop-loss placement, and profit target.
Anatomy (Structure) of a Wedge Pattern
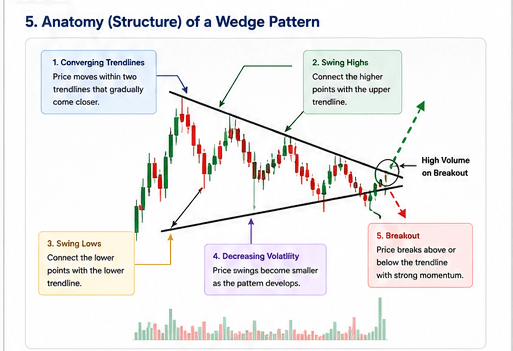
Before trading a Wedge Pattern, it’s important to understand its structure. Many beginners identify wedge patterns too early or confuse them with triangles and channels. Learning the key components of a wedge will help you recognize high-quality setups and avoid false signals.
A valid Wedge Pattern consists of the following elements:
1. Converging Trendlines
The most distinctive feature of a wedge is its two converging trendlines.
- The upper trendline connects the swing highs.
- The lower trendline connects the swing lows.
Unlike channels, where the trendlines remain parallel, wedge trendlines move closer together over time. This narrowing price range indicates that the current trend is gradually losing momentum.
The more times the price respects both trendlines without breaking them, the stronger the pattern becomes.
2. Swing Highs and Swing Lows
Every wedge is formed by a series of swing highs and swing lows.
In a Rising Wedge, the price continues making:
- Higher Highs (HH)
- Higher Lows (HL)
However, each new high becomes smaller than the previous one.
In a Falling Wedge, the market creates:
- Lower Highs (LH)
- Lower Lows (LL)
But each decline loses momentum, suggesting that sellers are becoming exhausted.
These swings reveal the gradual shift in market strength before the breakout.
3. Decreasing Volatility
One of the clearest characteristics of a wedge pattern is contracting volatility.
At the beginning of the pattern, price swings are relatively large. As the pattern develops, buyers and sellers become more cautious, causing each move to become smaller.
This reduction in volatility often indicates that the market is preparing for a strong directional move.
Think of it as a spring being compressed—the longer the compression lasts, the greater the potential energy stored for the eventual breakout.
4. Declining Trading Volume
Volume plays a crucial role in validating a wedge pattern.
As the pattern develops, trading volume often decreases because market participants become uncertain about the next direction.
When the breakout finally occurs, volume should increase significantly.
A breakout supported by high volume is generally considered more reliable than one that occurs on weak volume.
5. Breakout
The breakout is the final and most important stage of the pattern.
This is the point where buyers or sellers finally gain control of the market.
A valid breakout usually includes:
- A strong candle closing outside the trendline.
- Increased trading volume.
- Strong momentum in the breakout direction.
Professional traders rarely enter before the breakout because the pattern remains incomplete until price actually leaves the wedge.
Key Characteristics of a Valid Wedge Pattern
A high-quality wedge generally includes:
- Two converging trendlines.
- At least five touchpoints (three on one trendline and two on the other).
- Gradually decreasing volatility.
- Declining volume during formation.
- Strong breakout accompanied by higher volume.
- A clear trend before the pattern begins.
The cleaner the structure, the more reliable the pattern tends to be.
Market Psychology Behind the Wedge Pattern
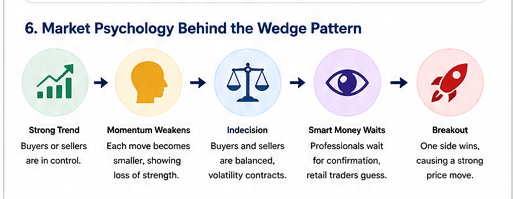
Understanding market psychology is what separates experienced traders from beginners. Instead of simply memorizing chart patterns, successful traders focus on the emotions and decisions that create those patterns.
A Wedge Pattern forms because the balance between buyers and sellers gradually changes over time.
Let’s examine each stage.
Stage 1: Strong Trend
Every wedge begins after a noticeable trend.
- In a Rising Wedge, buyers are in control.
- In a Falling Wedge, sellers dominate the market.
Confidence is high, and traders expect the trend to continue.
This attracts more participants who fear missing out on potential profits.
Stage 2: Momentum Starts Weakening
As the trend continues, momentum slowly decreases.
Although the market keeps making new highs or new lows, each move becomes smaller than the previous one.
This happens because:
- Early traders begin taking profits.
- New buyers or sellers become less aggressive.
- Institutions gradually reduce their positions.
The market still trends in the same direction, but its strength is fading.
Stage 3: Indecision Builds
This is where the wedge becomes visible.
Neither buyers nor sellers have enough strength to create large price swings.
Every rally is quickly met with selling pressure.
Every decline attracts buying interest.
As a result:
- Price movements become smaller.
- Volatility decreases.
- Trading volume often declines.
The market enters a period of temporary equilibrium.
Stage 4: Smart Money Waits
Professional traders and institutions rarely chase prices during this stage.
Instead, they patiently wait for confirmation.
They know that entering before the breakout increases the risk of getting trapped in a false move.
Retail traders often make the opposite mistake by predicting the breakout direction instead of waiting for confirmation.
Stage 5: Breakout
Eventually, one side gains control.
In a Rising Wedge, sellers become stronger than buyers.
In a Falling Wedge, buyers overpower sellers.
The breakout often triggers:
- Stop-loss orders.
- New market orders.
- Momentum traders entering positions.
This combination creates a rapid price movement.
Why Does the Breakout Become So Powerful?
The breakout is powerful because several groups of traders act at the same time.
For example:
- Traders holding losing positions rush to exit.
- Breakout traders open new positions.
- Institutional traders increase their exposure.
- Algorithmic trading systems detect the breakout and place automatic orders.
This sudden increase in buying or selling activity often explains why wedge breakouts can lead to sharp price movements.
Understanding this psychology helps traders trust the breakout instead of reacting emotionally.
Rising Wedge Pattern Explained
(Insert your “Rising Wedge Pattern” image here.)
The Rising Wedge Pattern is one of the most reliable bearish chart patterns in technical analysis. Although the market continues moving upward, the buying momentum gradually weakens.
Many beginners mistake a Rising Wedge for a strong bullish trend because the price continues making higher highs.
However, experienced traders recognize that each new rally is becoming weaker.
How the Pattern Forms
A Rising Wedge develops when:
- The price makes higher highs.
- The price also makes higher lows.
- Both trendlines slope upward.
- The lower trendline rises faster than the upper trendline.
As the trading range narrows, buyers struggle to push prices significantly higher.
Eventually, sellers gain control.
Trading the Rising Wedge
Most traders follow these steps:
- Identify the converging trendlines.
- Wait for a candle to close below the lower trendline.
- Confirm the breakout using increased volume.
- Enter a short position.
- Place the stop loss above the recent swing high.
- Set the target using the measured move technique.
Patience is essential because entering before confirmation increases the risk of false breakdowns.
Falling Wedge Pattern Explained
(Insert your “Falling Wedge Pattern” image here.)
The Falling Wedge Pattern is generally considered a bullish chart pattern. It signals that sellers are losing momentum and buyers may soon regain control.
Although prices continue declining, the selling pressure gradually decreases.
Formation
The Falling Wedge develops when:
- Price creates lower highs.
- Price creates lower lows.
- Both trendlines slope downward.
- The upper trendline declines faster than the lower trendline.
This narrowing price range indicates that sellers are becoming exhausted.
Trading the Falling Wedge
Professional traders usually wait for:
- A strong candle closing above the upper trendline.
- Increased trading volume.
- Optional retest of the broken trendline.
After confirmation:
- Enter a long position.
- Place the stop loss below the recent swing low.
- Use the measured move method to estimate the profit target.
The Falling Wedge often provides attractive risk-to-reward opportunities because the stop loss remains relatively small while the potential upside can be substantial.
How to Identify a Valid Wedge Pattern
Many traders can recognize the shape of a Wedge Pattern, but only a few know how to determine whether it is a high-quality trading setup. Entering trades based on incomplete or poorly formed wedges often leads to false breakouts and unnecessary losses.
A valid Wedge Pattern is more than just two converging trendlines. It represents a gradual shift in market momentum, and several conditions should be met before considering a trade.
1. A Clear Prior Trend Must Exist
A wedge should never appear in isolation. It must develop after an existing trend.
- A Rising Wedge usually forms after a strong uptrend.
- A Falling Wedge generally develops after a clear downtrend.
Without a prior trend, the pattern loses much of its significance because there is no momentum to reverse or continue.
Tip: If the market has been moving sideways for a long time, avoid trading wedge patterns as they are less reliable.
2. Look for Two Converging Trendlines
The most important characteristic of a wedge is its converging trendlines.
Draw one trendline connecting the swing highs and another connecting the swing lows. As the pattern develops, these lines should gradually move closer together.
Avoid forcing trendlines to fit the price. If multiple candles break outside the trendlines before the breakout, the pattern is likely invalid.
3. At Least Five Touchpoints
Professional traders often look for five or more touchpoints before considering a wedge complete.
A strong wedge typically has:
- Three touches on one trendline.
- Two touches on the opposite trendline.
More touchpoints indicate that both buyers and sellers respect the trendlines, making the eventual breakout more meaningful.
4. Declining Trading Volume
Volume often tells the real story behind the price.
As the wedge develops:
- Trading activity decreases.
- Buyers and sellers become less aggressive.
- Market participation gradually declines.
A noticeable increase in volume during the breakout confirms that one side has finally gained control.
5. Wait for Breakout Confirmation
One of the biggest mistakes beginners make is entering before confirmation.
A wedge is not complete until the price closes outside one of the trendlines.
Confirmation usually includes:
- A strong bullish or bearish candle.
- Increased trading volume.
- Momentum continuing in the breakout direction.
Patience often separates profitable traders from emotional traders.
6. Check the Higher Timeframe
Before entering any trade, analyze the next higher timeframe.
For example:
- If trading on the 1-hour chart, check the 4-hour chart.
- If trading on the 4-hour chart, check the Daily chart.
Trading in the direction of the higher-timeframe trend generally provides stronger and more reliable setups.
Checklist for Identifying a Valid Wedge
Before placing a trade, ask yourself:
- ✅ Is there a clear prior trend?
- ✅ Are the trendlines converging?
- ✅ Does the pattern have at least five touchpoints?
- ✅ Is volume decreasing during formation?
- ✅ Has the breakout been confirmed?
- ✅ Does the higher timeframe support the trade?
If the answer is “Yes” to most of these questions, the wedge is more likely to be a high-quality setup.
How to Trade a Wedge Pattern
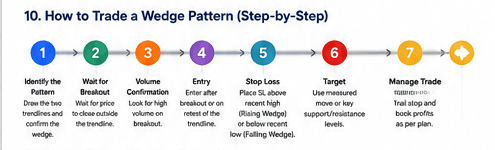
Identifying a wedge is only the first step. Successful traders wait for confirmation, manage risk carefully, and follow a structured trading plan.
Here is a step-by-step approach used by many professional traders.
Step 1: Identify the Pattern
Begin by drawing the two converging trendlines.
Ensure that:
- Price respects both trendlines.
- The wedge develops after a clear trend.
- The pattern has multiple touchpoints.
Never trade a wedge that appears forced or incomplete.
Step 2: Wait for the Breakout
Avoid predicting the breakout direction.
Instead, wait for the price to close outside the wedge.
Many false breakouts occur because traders enter before confirmation.
A candle close outside the trendline is generally more reliable than an intraday price spike.
Step 3: Confirm with Volume
Volume adds confidence to the breakout.
A strong breakout is usually accompanied by:
- Increased trading volume.
- Strong momentum candles.
- Little immediate rejection.
Low-volume breakouts are more likely to fail.
Step 4: Choose Your Entry
There are three common entry methods.
Aggressive Entry
Enter immediately after the breakout candle closes.
Advantages
- Early entry.
- Larger potential profit.
Disadvantages
- Higher risk of false breakouts.
Conservative Entry
Wait for the price to retest the broken trendline.
If the trendline acts as new support or resistance, enter the trade.
This method reduces risk but may cause you to miss some opportunities.
Confirmation Entry
Wait for an additional confirmation, such as:
- A strong engulfing candle.
- Increased volume.
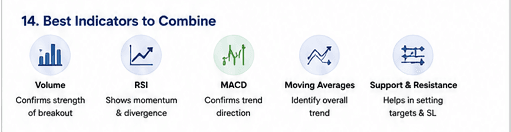
- RSI confirmation.
- MACD crossover.
This approach offers the highest confirmation but the latest entry.
Step 5: Place Your Stop Loss
Every trade should include a stop loss.
For a Rising Wedge, place the stop loss above the most recent swing high.
For a Falling Wedge, place it below the most recent swing low.
Avoid placing the stop loss too close to the breakout because normal market fluctuations may trigger it.
Step 6: Set Your Profit Target
One of the most common methods is the Measured Move Technique.
Measure the widest part of the wedge and project the same distance from the breakout point.
You can also use:
- Previous support and resistance levels.
- Fibonacci Extension levels.
- Trailing stop-loss strategy.
Always aim for a minimum Risk-to-Reward Ratio of 1:2.
Rising Wedge Pattern Trading Example
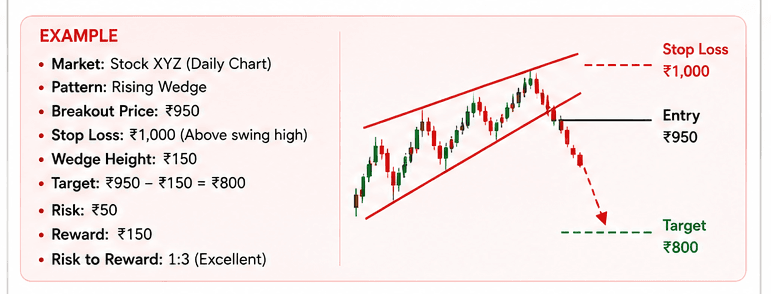
Let’s understand the trading process with a simple example.
Suppose the stock XYZ Ltd. has been in a strong uptrend for several weeks.
Gradually, the price begins forming a Rising Wedge Pattern.
During this phase:
- The stock continues making higher highs.
- Each rally becomes smaller.
- Trading volume steadily declines.
Finally, the price closes below the lower trendline with a large bearish candle and a noticeable increase in volume.
Trade Setup
- Entry: 950 (after the confirmed breakout)
- Stop Loss: 1000 (above the recent swing high)
- Target: 800 (measured move projection)
The trade offers:
- Risk = 50
- Reward = 150
This gives a Risk-to-Reward Ratio of 1:3, which many professional traders consider acceptable.
Instead of guessing where the market will go, this approach relies on confirmation, logical stop-loss placement, and predefined profit targets.
Falling Wedge Pattern Trading Example
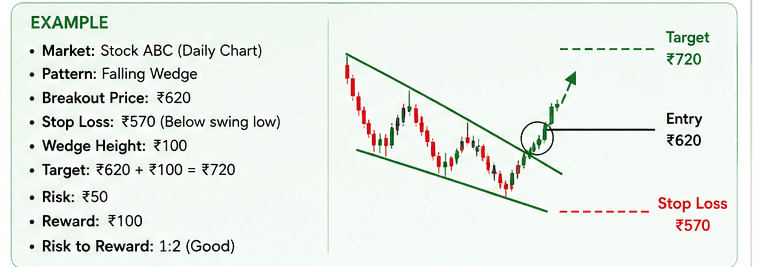
Let’s understand the trading process with a simple example.
Suppose the stock ABC Ltd. has been in a strong downtrend for several weeks.
Gradually, the price begins forming a Falling Wedge Pattern.
During this phase:
- The stock continues making lower highs.
- Each decline becomes smaller, indicating that sellers are losing momentum.
- Trading volume steadily declines as market participation decreases.
Finally, the price breaks above the upper trendline with a strong bullish candle accompanied by a noticeable increase in trading volume. This breakout confirms that buyers have gained control and the downtrend may be reversing.
Trade Setup
- Entry: 620 (after the confirmed breakout)
- Stop Loss: 570 (below the recent swing low)
- Target: 720 (measured move projection)
The trade offers:
- Risk = 50
- Reward = 100
This gives a Risk-to-Reward Ratio of 1:2, which many professional traders consider a healthy balance between risk and potential return.
Rather than predicting the exact market bottom, this strategy focuses on waiting for breakout confirmation, placing the stop loss below the recent swing low, and using the measured move technique to estimate a realistic profit target. This disciplined approach helps traders reduce emotional decisions and improve long-term consistency.
Volume Analysis in a Wedge Pattern
Volume is one of the most overlooked aspects of trading wedge patterns. While price shows what is happening, volume often explains why it is happening.
Understanding volume can help traders separate genuine breakouts from false signals.
Volume During Pattern Formation
As the wedge develops:
- Buyers become less aggressive.
- Sellers also reduce activity.
- Market participation gradually decreases.
As a result, trading volume usually trends lower throughout the pattern.
This reflects growing uncertainty and a temporary balance between buyers and sellers.
Volume During the Breakout
The most reliable wedge breakouts are usually accompanied by a noticeable increase in trading volume.
Higher volume indicates:
- New traders entering the market.
- Existing traders closing positions.
- Institutional participation.
- Strong conviction behind the breakout.
If price breaks out without increased volume, traders should be cautious because the breakout may lack strength.
Using Volume for Confirmation
Many experienced traders combine price action with volume before entering a trade.
A high-quality breakout often includes:
- Strong closing candle.
- Increased volume.
- Momentum continuing after the breakout.
If all three conditions are present, the probability of a successful trade generally improves.
Why Volume Matters
Think of volume as the fuel behind a price move.
A breakout without volume is like a car trying to accelerate with very little fuel—it may start moving, but it often struggles to continue.
On the other hand, a breakout supported by strong volume has greater participation and is more likely to sustain its direction.
This is why many professional traders never rely on price alone when trading wedge patterns.