Introduction
Have you ever wondered why the market suddenly moves above yesterday’s high, triggers thousands of stop-loss orders, and then reverses sharply in the opposite direction?
Liquidity in trading is one of the most important concepts every trader should understand. It explains why institutions move prices toward areas with large concentrations of orders.” In reality, these movements are often driven by one of the most important concepts in Smart Money Trading—Liquidity.
Liquidity is the fuel that allows banks, hedge funds, and other large institutions to execute massive buy and sell orders without causing excessive price disruption. Understanding where liquidity is located and how professional traders use it can completely change the way you read price charts.
Instead of chasing every breakout, you’ll begin asking a different question:
“Where is the market likely to find liquidity next?”
That single shift in thinking can help you understand why prices frequently move into obvious support and resistance levels before reversing.
In this guide, you’ll learn:
- What liquidity is in simple language.
- Why institutional traders depend on liquidity.
- The difference between Buy-Side and Sell-Side Liquidity.
- How liquidity grabs and liquidity sweeps work.
- How to identify liquidity zones on a chart.
- Practical trading strategies based on liquidity.
Whether you’re new to trading or already learning Smart Money Concepts (SMC), this guide will provide a strong foundation.
What is Liquidity?
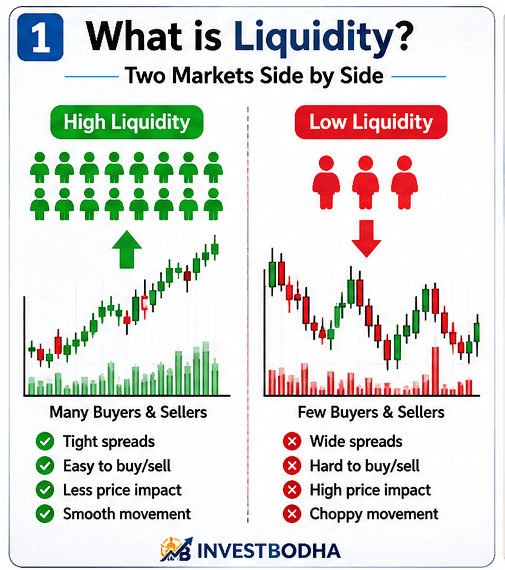
Liquidity refers to the availability of buyers and sellers in a financial market.
In simple terms, liquidity is the ease with which an asset can be bought or sold without causing a significant change in its price.
Imagine you’re trying to sell a mobile phone.
If 500 people are willing to buy it immediately, selling is easy. The market has high liquidity.
If only one person is interested, selling becomes difficult. The market has low liquidity.
The same principle applies to stocks, forex, commodities, and cryptocurrencies.
In financial markets, liquidity comes from the pending orders placed by traders. Every buy order and sell order contributes to the overall liquidity available in the market.
A Simple Example
Suppose Reliance Industries is trading at 1,500.
At this price:
- Thousands of traders are placing buy orders.
- Thousands of traders are placing sell orders.
- Institutions are entering and exiting positions.
- Market makers are continuously providing quotes.
Because many participants are trading simultaneously, Reliance is considered a highly liquid stock.
Now imagine a small company where only a few shares are traded each day. Buying or selling a large quantity could move the price significantly. This is a low-liquidity market.
Why Does Liquidity Matter?
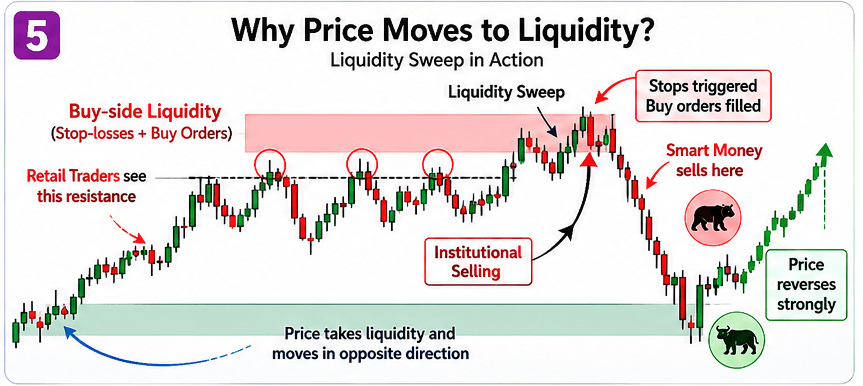
Liquidity is one of the most important factors influencing price movement.
Large financial institutions often trade positions worth millions or even billions of rupees. They cannot simply click the “Buy” button and purchase everything at the current market price.
Doing so would push the price sharply higher before their entire order is filled.
Instead, they search for areas where many opposite orders already exist. These areas provide the liquidity needed to execute large trades efficiently.
This is why price often moves toward obvious highs, lows, support, resistance, and breakout levels—these locations contain clusters of pending orders.
How Retail Traders Think vs. How Institutions Think
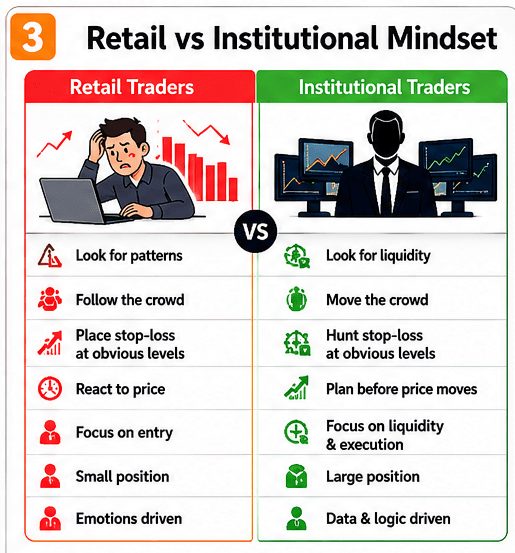
One of the biggest mindset changes in Smart Money Concepts is understanding that institutions are not randomly moving the market. Their primary objective is to find enough liquidity to fill large orders.
Who Creates Liquidity?
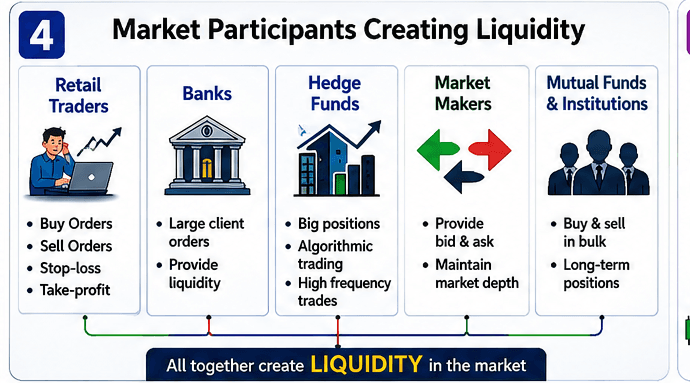
Every market participant contributes to liquidity.
Retail Traders
Retail traders’ place:
- Buy orders
- Sell orders
- Stop-loss orders
- Take-profit orders
Although individual orders are small, millions of retail traders together create substantial liquidity.
Banks
Commercial and investment banks execute large currency and equity transactions for clients and themselves.
Because of the enormous size of these trades, banks require deep liquidity to avoid moving prices excessively.
Hedge Funds
Hedge funds actively trade large positions based on quantitative models, macroeconomic analysis, and technical strategies.
Their activity adds significant liquidity to the market.
Market Makers
Market makers continuously provide both buy and sell quotes.
Their role is to ensure that traders can enter and exit positions efficiently, helping maintain smooth market operations.
Mutual Funds and Pension Funds
Large investment funds regularly buy and sell securities as part of portfolio management.
Their transactions contribute substantial liquidity, particularly in highly traded stocks and indices.
Why Institutions Need Liquidity
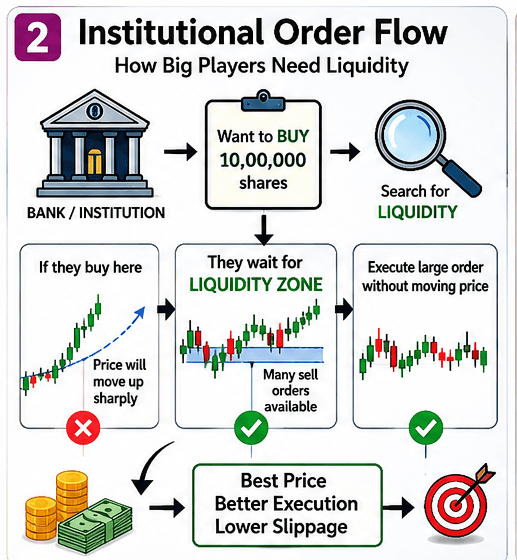
Imagine an institution wants to buy 500 crore worth of a stock.
If it starts buying aggressively at the current market price, the price will rise rapidly, making the purchase much more expensive.
Instead, the institution waits for the price to reach an area where many sell orders are available. This provides enough liquidity to absorb its large buy order without causing excessive price movement.
Similarly, when selling a large position, institutions seek areas with abundant buy orders.
This behavior explains why prices frequently revisit previous highs, previous lows, support levels, resistance zones, and other obvious chart structures.
These areas contain the liquidity needed for large transactions.
Key Takeaways
✔ Liquidity represents the availability of buyers and sellers in the market.
✔ High liquidity allows assets to be traded easily with minimal price impact.
✔ Institutions rely on liquidity to execute large orders efficiently.
✔ Obvious chart levels often attract price because they contain clusters of pending orders.
✔ Understanding liquidity shifts your focus from reacting to price movements to anticipating where the price is likely to move next.
Buy-Side Liquidity (BSL)
Imagine you’re standing at a traffic signal during rush hour. Hundreds of cars are waiting at the red light. Once the signal turns green, all the cars move together.
The financial market works similarly.
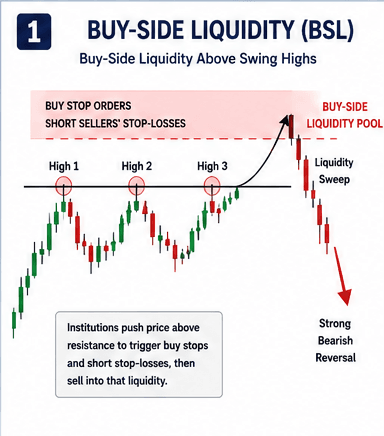
When many traders place their buy stop orders or short sellers’ stop-loss orders at the same price level, they create a pool of liquidity.
This pool is known as Buy-Side Liquidity (BSL).
Definition
Buy-Side Liquidity refers to a cluster of buy orders located above recent swing highs or resistance levels.
These buy orders generally come from:
- Traders entering breakout trades.
- Stop losses for traders holding short positions.
- Pending Buy Stop Orders.
- Algorithmic trading systems.
Because these orders are concentrated in one area, institutions often target them before initiating a major move.
Why Does Buy-Side Liquidity Exist?
Retail traders are taught a simple rule:
“Buy when price breaks above resistance.”
As a result, thousands of traders place Buy Stop orders just above the same resistance level.
Similarly, traders who sold near the resistance often place their stop-losses just above it.
This creates a large concentration of buy orders.
Professional traders recognize this cluster as a valuable source of liquidity.
Example of Buy-Side Liquidity
Suppose the Nifty 50 has formed three consecutive highs around 25,800.
Thousands of traders observe the same chart.
Some decide:
- “I’ll buy once the price crosses 25,800.”
Others think:
- “I’m short. My stop-loss is above 25,800.”
Both groups place orders in nearly the same area.
Now imagine a large institution wants to sell a significant quantity of Nifty futures.
Instead of selling immediately, it waits for the price to rise into the buy-side liquidity zone.
Once enough buy orders are triggered, the institution can sell into that demand.
Price often reverses shortly afterward.
This sequence is known as a liquidity sweep.
Characteristics of Buy-Side Liquidity
- Located above swing highs.
- Often found above resistance levels.
- Contains Buy Stop orders.
- Contains stop losses of short sellers.
- Frequently targeted before bearish reversals.
- Common in trending and ranging markets.
Sell-Side Liquidity (SSL)
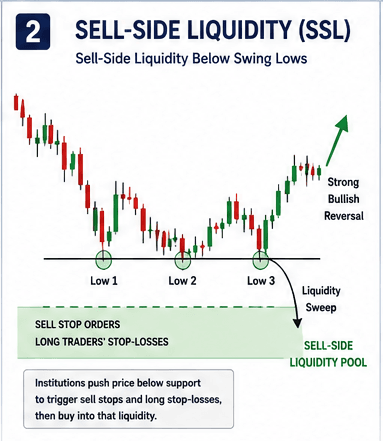
Sell-Side Liquidity is simply the opposite of Buy-Side Liquidity.
Instead of looking above highs, institutions now focus on below lows.
Definition
Sell-Side Liquidity is a cluster of sell orders located below recent swing lows or support levels.
These orders usually include:
- Sell Stop orders.
- Stop losses of long traders.
- Breakdown traders.
- Algorithmic sell orders.
Why Does Sell-Side Liquidity Exist?
Retail traders are often told:
“Sell when price breaks below support.”
Consequently:
- Long traders place stop-losses below support.
- Breakout traders place Sell Stop orders below support.
These orders accumulate beneath obvious lows.
Institutions may deliberately push prices below support to trigger these orders.
Once sufficient liquidity is available, they frequently begin buying.
Example
Suppose Bank Nifty has respected support at 56,000 for several days.
Most traders expect support to hold.
Their stop-losses are placed just below 56,000.
One morning, the price falls sharply below support.
Many traders panic and sell.
However, after collecting these sell orders, the price reverses strongly upward.
Retail traders call it a “false breakdown.”
Smart Money traders recognize it as a Sell-Side Liquidity Sweep.
Characteristics of Sell-Side Liquidity
- Found below swing lows.
- Found below support.
- Contains stop losses for buyers.
- Contains Sell Stop orders.
- Frequently targeted before bullish reversals.
- Common before institutional accumulation.
Liquidity Pools
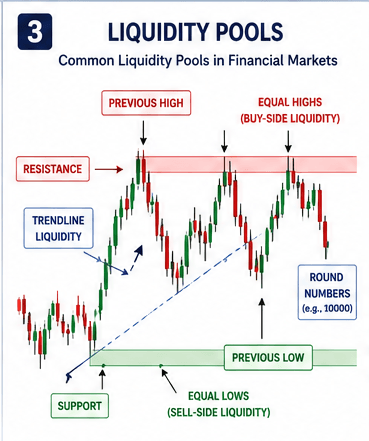
A Liquidity Pool is an area where a large number of pending orders are concentrated.
Think of it as a location where institutions expect to find enough buyers or sellers to execute large positions efficiently.
Liquidity pools commonly form around:
- Equal Highs
- Equal Lows
- Previous Day High
- Previous Day Low
- Weekly High
- Weekly Low
- Monthly High
- Monthly Low
- Psychological Levels (e.g., ₹100, ₹500, ₹1000)
- Trendline Breakouts
- Support
- Resistance
Professional traders pay close attention to these areas because prices often gravitate toward them before making their next significant move.
Equal Highs
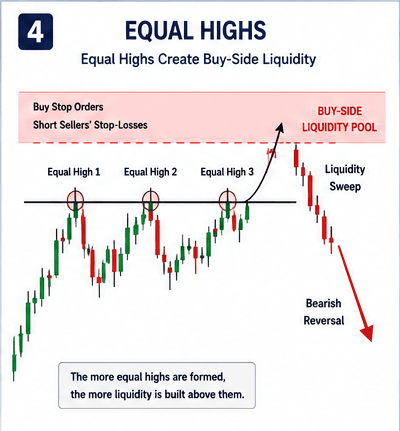
Equal highs occur when price tests approximately the same high level multiple times without breaking through.
Retail traders often view this as a strong resistance.
Smart Money traders see something different:
They recognize a growing pool of buy-side liquidity above those highs.
The more obvious the level becomes, the more stop-losses and breakout orders accumulate.
This increases the probability that price will briefly move above the highs before reversing.
Equal Lows
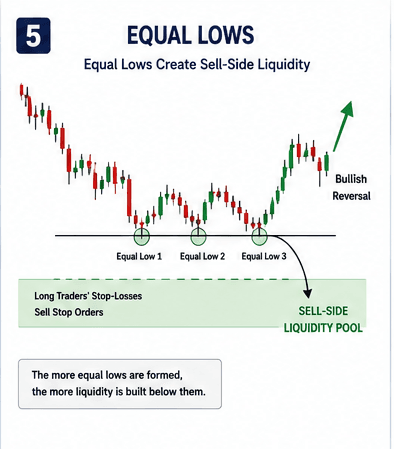
Equal lows form when price repeatedly tests the same support level.
Retail traders interpret this as strong support.
Smart Money traders understand that stop-losses from long positions and Sell Stop orders are accumulating beneath those lows.
These orders create Sell-Side Liquidity.
Institutions often push price below these lows to trigger the liquidity before reversing upward.
Liquidity Sweep Explained: How Institutions Take Liquidity
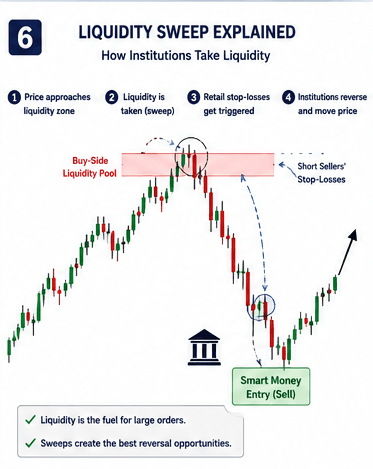
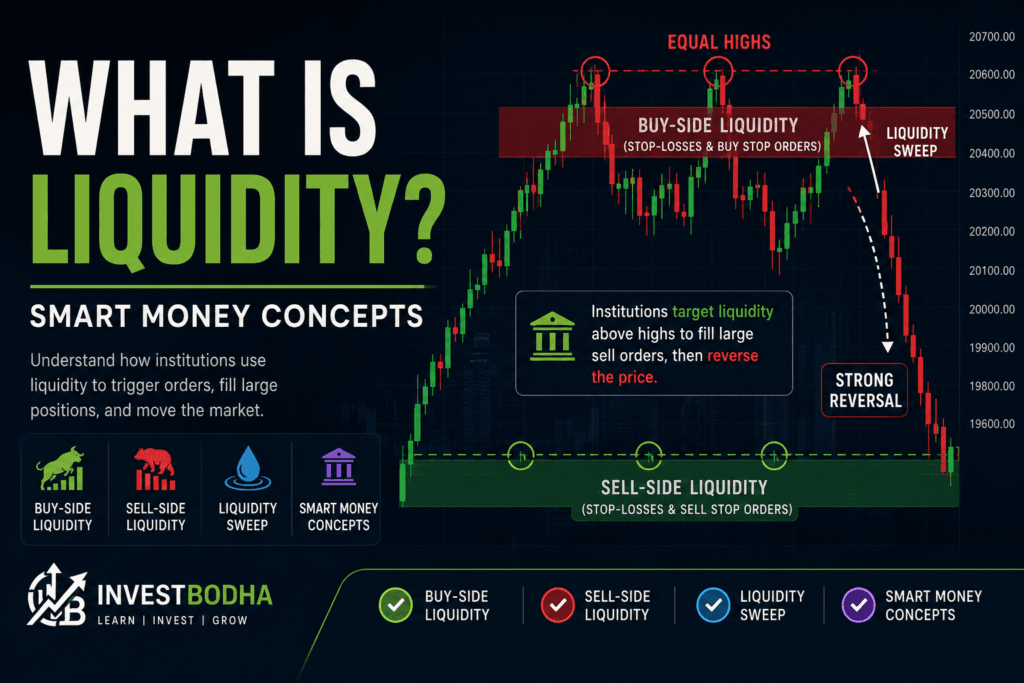
A Liquidity Sweep occurs when the market briefly moves above a recent high or below a recent low to trigger stop-loss orders and pending orders before reversing direction. This is a common strategy used by institutional traders to access the liquidity needed for large buy or sell positions.
In the chart above, the price first moves into the Buy-Side Liquidity Pool, where breakout traders enter long positions and short sellers’ stop-losses are triggered. Once sufficient liquidity is collected, institutions execute their sell orders, causing the market to reverse sharply.
Many retail traders mistake this move for a genuine breakout and get trapped when the price changes direction. Instead of entering immediately after a breakout, traders should wait for confirmation, such as a rejection candle, Break of Structure (BOS), or Order Block. Understanding liquidity sweeps helps traders avoid false breakouts and make more informed trading decisions.
How to Identify Liquidity Zones
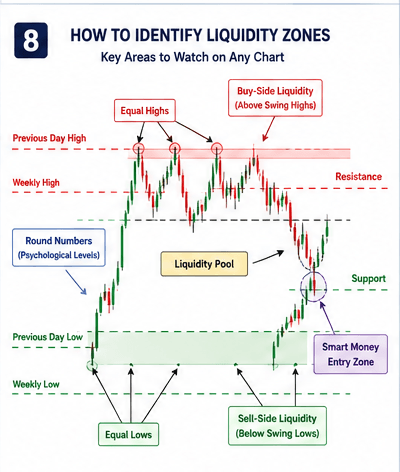
When analyzing a chart, ask yourself these questions:
- Where are the most obvious swing highs?
- Where are the most obvious swing lows?
- Where would most retail traders place their stop-losses?
- Where would breakout traders likely enter?
- Are there equal highs or equal lows?
- Is the price approaching a previous day’s high or low?
- Is there a psychological price level nearby?
If several of these conditions overlap, you’ve likely identified an important liquidity zone.
Common Mistakes Beginners Make
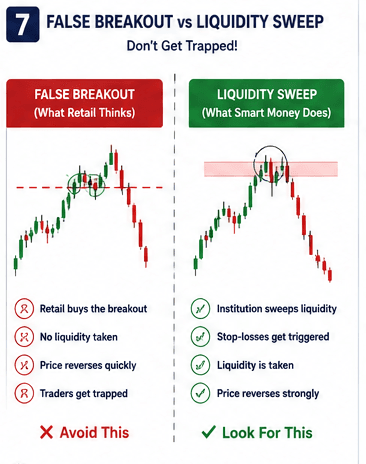
❌ Buying immediately after every breakout.
❌ Selling immediately after every breakdown.
❌ Placing stop-losses at obvious highs and lows.
❌ Ignoring liquidity when analyzing charts.
❌ Assuming every support or resistance level will hold indefinitely.
Conclusion
Liquidity is one of the most important concepts in Smart Money Trading because it explains why the market moves, not just how it moves. Instead of viewing every breakout or breakdown as a trading opportunity, professional traders first identify where liquidity is likely to be resting.
By understanding Buy-Side Liquidity, Sell-Side Liquidity, Liquidity Pools, and Liquidity Sweeps, you can better anticipate institutional behavior and avoid common retail trading mistakes. Remember, institutions require liquidity to execute large orders, which is why prices often target obvious highs, lows, support, and resistance before making its next major move.
No trading concept is perfect on its own. For better accuracy, combine liquidity analysis with Order Blocks, Fair Value Gaps (FVGs), Break of Structure (BOS), and sound risk management. With regular practice and chart analysis, you’ll begin to recognize liquidity zones more confidently and make better-informed trading decisions.
Frequently Asked Questions (FAQs)
1. What is liquidity in trading?
Liquidity in trading refers to the availability of buyers and sellers in the market. A highly liquid market allows traders to buy or sell assets quickly without causing significant price changes.
2. What is Buy-Side Liquidity?
Buy-Side Liquidity (BSL) is a cluster of buy orders located above recent swing highs or resistance levels. It usually consists of breakout buy orders and stop-losses from short sellers.
3. What is Sell-Side Liquidity?
Sell-Side Liquidity (SSL) is a cluster of sell orders found below recent swing lows or support levels. It includes stop-losses of long traders and Sell Stop orders placed by breakdown traders.
4. What is a Liquidity Sweep?
A liquidity sweep occurs when price briefly moves above a high or below a low to trigger stop-losses and pending orders before reversing direction. Institutions often use this strategy to access the liquidity needed for large trades.
5. Why do institutions target liquidity?
Institutions trade very large positions that cannot be executed instantly without affecting the market price. They target liquidity zones because these areas contain enough buy or sell orders to absorb their trades efficiently.
6. How can I identify liquidity zones?
Liquidity zones are commonly found around equal highs, equal lows, previous day’s highs and lows, support, resistance, trendline breakouts, and psychological price levels where many traders place their orders.
7. Is liquidity trading suitable for beginners?
Yes. Understanding liquidity helps beginners avoid false breakouts and better understand how institutional traders move the market. However, it should be combined with proper risk management and confirmation signals.
8. What is the difference between a Liquidity Grab and a Liquidity Sweep?
Both involve collecting liquidity around key price levels. A liquidity grab is usually a quick spike beyond a level followed by an immediate reversal, while a liquidity sweep may take more time as institutions gradually collect orders before reversing the market.