Introduction
If you have been learning technical analysis for a while, you have probably come across the Ascending Triangle Pattern. It is one of the most popular chart patterns because it is simple to identify and can provide high-probability trading opportunities when used correctly.
However, many beginners make the mistake of buying as soon as they see a triangle forming. In reality, not every Ascending Triangle leads to a successful breakout. Some patterns fail, while others trap traders with false breakouts. This is why understanding the psychology behind the pattern is just as important as recognizing its shape.
In this complete guide, you’ll learn everything you need to know about the Ascending Triangle Pattern—from how it forms and why it works to the best entry strategy, stop-loss placement, profit targets, confirmation techniques, and common mistakes to avoid.
Whether you’re an intraday trader, swing trader, or long-term investor, this guide will help you trade the pattern with more confidence.
Let’s start with the basics.
What is the Ascending Triangle Pattern?
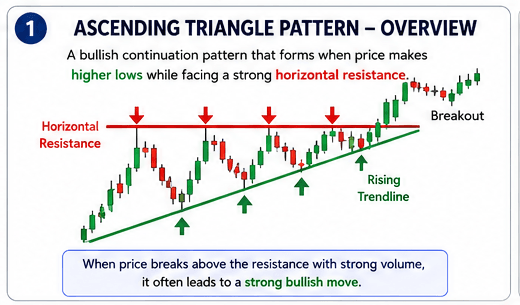
The Ascending Triangle Pattern is a bullish chart pattern that usually appears during an uptrend. It shows that buyers are gradually becoming stronger while sellers continue defending the same resistance level.
The pattern is created when the price forms a flat resistance line at the top and a rising trendline at the bottom. As time passes, the price gets squeezed into a smaller range until one side finally takes control.
In most cases, buyers win this battle. Once the resistance is broken with strong momentum, the price often starts a fresh upward move.
This is why the Ascending Triangle is considered one of the most reliable bullish continuation patterns in technical analysis.
Key Characteristics of an Ascending Triangle
- A clear uptrend before the pattern begins.
- A horizontal resistance level where the price gets rejected multiple times.
- Higher lows that create an upward-sloping support line.
- Price gradually moves into a tighter range.
- Volume often decreases while the pattern is forming.
- A breakout above resistance is usually accompanied by higher trading volume.
When all these characteristics appear together, the pattern becomes much more reliable.
Why is it Called an “Ascending” Triangle?
The name comes from the shape of the pattern.
The lower trendline keeps moving upward because buyers are willing to purchase the stock at increasingly higher prices. At the same time, the resistance remains almost flat because sellers continue defending the same price zone.
As these two lines move closer together, they create a triangle that points upward. This unique structure reflects growing buying pressure, which is why traders closely watch it for a potential breakout.
Where Does the Ascending Triangle Pattern Appear?
One of the biggest advantages of this pattern is its versatility. It can be found across almost every financial market.
You can spot an Ascending Triangle in:
- Stocks
- Equity indices
- Forex pairs
- Commodities
- Cryptocurrencies
- Exchange Traded Funds (ETFs)
The pattern also works across different timeframes. Whether you trade on a 5-minute chart, 15-minute chart, 1-hour chart, or daily chart, the same principles remain applicable. However, patterns formed on higher timeframes are generally considered more reliable because they involve stronger market participation.
Is the Ascending Triangle Always Bullish?
Not necessarily.
Although the Ascending Triangle is primarily known as a bullish continuation pattern, it does not guarantee that the price will always move higher.
Sometimes the breakout fails because buyers are unable to absorb the selling pressure. In such cases, the price may quickly fall back below the resistance level, creating a false breakout.
This is why experienced traders never enter a trade simply because they see an Ascending Triangle. They wait for additional confirmation, such as:
- A strong bullish breakout candle.
- Increased trading volume.
- Support from technical indicators.
- A successful retest of the breakout level.
Using confirmation significantly improves the quality of your trades and helps reduce the chances of getting trapped in fake breakouts.
Why Do Traders Like This Pattern?
The Ascending Triangle is popular because it provides a clear trading structure.
Before entering a trade, you already know:
- Where the entry can be planned.
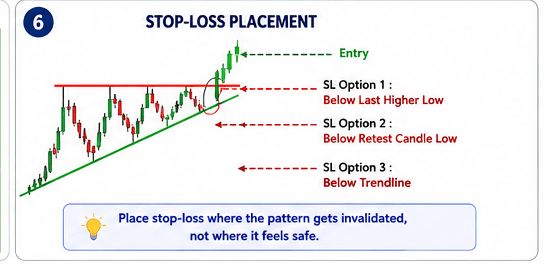
- Where the stop-loss should be placed.
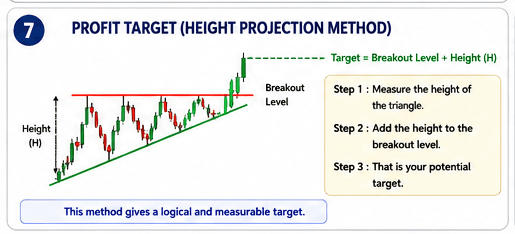
- How the profit target can be calculated.
- Whether the trade offers a favorable risk-to-reward ratio.
Instead of making emotional decisions, traders can prepare their entire trading plan before the breakout even happens. This disciplined approach is one of the biggest reasons why the pattern is widely used by professional traders.
Psychology Behind the Ascending Triangle Pattern
For chart view – https://www.tradingview.com/
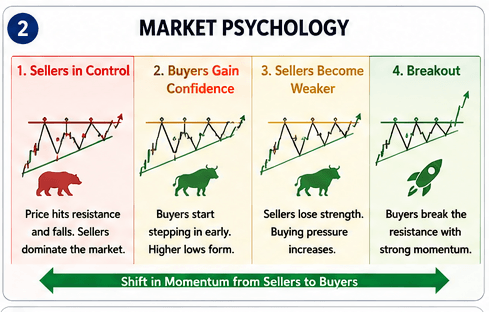
Many traders can identify an Ascending Triangle on the chart, but only a few truly understand why it forms. Once you understand the psychology behind the pattern, you’ll stop memorizing shapes and start reading the market with confidence.
Every candlestick on the chart represents a battle between buyers and sellers. The Ascending Triangle is simply a visual representation of that battle.
Let’s understand what is happening step by step.
Stage 1: Buyers Are in Control
The pattern usually begins after a strong uptrend. This tells us that buyers are already dominating the market and demand is higher than supply.
As the price moves higher, more traders become interested in buying the stock. The overall market sentiment remains positive, and buyers continue pushing the price upward.
At this stage, everything looks normal, and the trend is still bullish.
Stage 2: Sellers Defend One Price Level
Eventually, the price reaches a level where many sellers are waiting.
Every time the price touches this resistance, selling pressure increases and the market moves lower.
This creates a flat resistance line, which becomes one of the key features of the Ascending Triangle.
At first glance, it may look like sellers are stronger because the price keeps getting rejected from the same level. However, the complete picture tells a different story.
Stage 3: Buyers Refuse to Give Up
After each rejection, buyers step back into the market much sooner than before.
Instead of allowing the price to fall significantly, they start buying at higher levels.
As a result:
- The first correction is deep.
- The second correction is smaller.
- The third correction is even smaller.
This creates a series of higher lows, showing that buyers are becoming increasingly aggressive.
In simple words, buyers are no longer waiting for a big dip. They are happy to buy at higher prices because they believe the stock can move even higher.
This growing confidence is what creates the rising trendline.
Stage 4: Selling Pressure Starts Weakening
This is the most important phase of the pattern.
Although sellers continue defending the same resistance level, they are no longer able to push the price down as much as before.
Each rejection becomes weaker.
Each pullback becomes shorter.
The price spends more time near the resistance instead of falling away from it.
This is a strong sign that sellers are slowly losing control.
Stage 5: Buyers Absorb the Supply
Think of resistance as a shop selling a limited number of products.
Every time the price reaches resistance, buyers purchase the available shares.
Initially, sellers have enough supply to stop the rally.
But after several attempts, much of that selling supply gets absorbed.
Once there aren’t enough sellers left at that price, buyers face very little resistance.
That’s when the breakout usually happens.
This concept is often called supply absorption, and it explains why repeated tests of resistance can strengthen the chances of a bullish breakout.
Stage 6: The Breakout
Eventually, buyers gather enough strength to push the price above the resistance level.
This breakout often attracts new participants, including:
- Breakout traders.
- Momentum traders.
- Institutional investors.
- Short sellers covering their positions.
As fresh buying enters the market, momentum increases and the price often moves sharply upward.
This is why breakout candles are usually larger than the candles formed inside the pattern.
Why Higher Lows Are So Important
One of the biggest mistakes beginners make is focusing only on the horizontal resistance.
In reality, the higher lows tell the real story.
Every higher low shows that buyers are becoming more confident.
Instead of waiting for lower prices, they enter the market earlier.
This behavior reflects increasing demand, which is exactly what traders want to see before a bullish breakout.
The stronger and cleaner the higher lows, the healthier the Ascending Triangle generally becomes.
Why Volume Usually Decreases During the Pattern
Another common feature of the Ascending Triangle is declining volume while the pattern develops.
This happens because both buyers and sellers are waiting for the next major move.
As the price range becomes smaller, market activity naturally slows down.
However, once the breakout occurs, volume should increase significantly.
Higher breakout volume indicates strong participation and makes the breakout more reliable.
A breakout without volume should always be treated with caution because it has a higher chance of failing.
The Biggest Lesson from the Pattern
The Ascending Triangle is not just a triangle drawn on a chart.
It tells a complete story.
It shows buyers becoming stronger, sellers gradually losing their grip, and demand slowly overpowering supply.
When you learn to read this story instead of simply recognizing the shape, your trading decisions become more logical and less emotional.
That’s the real strength of technical analysis—it helps you understand what the market participants are doing, not just what the price looks like.
How to Identify a Valid Ascending Triangle Pattern
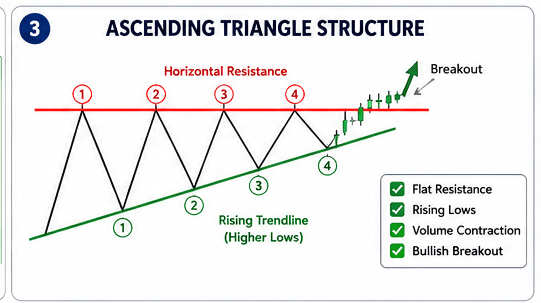
One of the biggest mistakes beginners make is assuming that every triangle on the chart is an Ascending Triangle. In reality, many patterns look similar but don’t meet the basic conditions. Trading such setups often leads to false breakouts and unnecessary losses.
Before planning any trade, make sure the pattern follows the checklist below.
1. A Prior Uptrend Should Be Present
An Ascending Triangle works best when it appears after a noticeable uptrend.
The reason is simple. The pattern is mainly a bullish continuation pattern, which means it is expected to continue the existing trend rather than start a completely new one.
If the market has been moving sideways for a long time, the breakout may not have enough momentum.
What to look for:
- Higher highs and higher lows before the pattern.
- Strong buying momentum.
- Positive market sentiment.
Pro Tip:
The stronger the trend before the pattern, the higher the probability of a successful breakout.
2. A Clear Horizontal Resistance
The top of the Ascending Triangle should be almost flat.
This resistance level acts like a ceiling where sellers repeatedly stop the price from moving higher.
Ideally, the price should test this level at least two or three times.
Multiple rejections show that this price level is important and that traders are actively watching it.
A resistance line with only one touch is generally not considered reliable.
3. Formation of Higher Lows
This is the heart of the pattern.
Each time the price pulls back, buyers enter earlier than before.
As a result, every new low is higher than the previous one.
When these lows are connected using a trendline, they create an upward-sloping support line.
This rising support tells us that buying pressure is increasing even though resistance remains unchanged.
Without higher lows, it is not an Ascending Triangle.
4. At Least Five Touch Points
Professional traders don’t rely on a pattern that has formed with only two or three touches.
A quality Ascending Triangle generally has:
- Two or three touches on the resistance line.
- Three or more touches on the rising support line.
More touch points mean the market has respected both support and resistance multiple times, making the pattern more trustworthy.
5. Price Range Should Gradually Narrow
As the pattern develops, the distance between support and resistance becomes smaller.
This narrowing range indicates that the market is preparing for a strong move.
If the price continues making large swings inside the triangle, the pattern is still incomplete.
A tighter structure usually leads to a more meaningful breakout.
6. Volume Should Reduce During Formation
Volume is often ignored by beginners, but it provides valuable confirmation.
While the Ascending Triangle is forming, trading activity generally slows down.
This decline in volume reflects a temporary balance between buyers and sellers.
However, once the breakout occurs, volume should increase sharply.
A breakout supported by high volume is usually more reliable than one with average or low volume.
7. Breakout Should Happen Before the End of the Triangle
Timing matters.
A healthy breakout usually occurs between 50% and 75% of the distance from the start of the pattern to the triangle’s apex.
If the price reaches the extreme end of the triangle without breaking out, the pattern starts losing its strength.
Late breakouts often fail because the market has already lost momentum.
Quick Checklist for a Valid Ascending Triangle
Before entering a trade, ask yourself these questions:
✅ Is there a clear uptrend before the pattern?
✅ Is the resistance level horizontal?
✅ Are higher lows clearly visible?
✅ Has the resistance been tested at least twice?
✅ Has the support been tested three or more times?
✅ Is the price range getting smaller?
✅ Is volume declining during the formation?
✅ Is the breakout happening before the apex?
If your answer is “Yes” to most of these questions, you’ve likely identified a high-quality Ascending Triangle.
Common Identification Mistakes
Even experienced traders occasionally misread chart patterns. Avoid these common mistakes to improve your accuracy.
Mistake 1: Trading Every Triangle
Not every triangle is an Ascending Triangle.
Some may actually be:
- Symmetrical Triangles
- Descending Triangles
- Pennants
- Wedges
Always confirm the structure before placing a trade.
Mistake 2: Ignoring the Previous Trend
An Ascending Triangle without a prior uptrend is much less reliable.
Always study the market context instead of looking at the pattern alone.
Mistake 3: Drawing Trendlines Incorrectly
Forcing trendlines to fit the pattern is a common error.
Trendlines should connect natural swing highs and swing lows.
If you have to adjust the lines repeatedly to make the pattern look like a triangle, it probably isn’t one.
Mistake 4: Entering Before Confirmation
Many traders buy simply because they expect a breakout.
But expectations don’t move the market—actual buying pressure does.
Waiting for confirmation can save you from many false breakouts.
Best Market Conditions to Trade the Ascending Triangle Pattern
Finding an Ascending Triangle on the chart doesn’t automatically mean you should take the trade. Like every chart pattern, it performs better in certain market conditions and becomes less reliable in others.
Understanding the overall market trend can significantly improve your win rate. A strong pattern traded in the right market environment often has a much higher chance of success than the same pattern traded in the wrong conditions.
Let’s see when the Ascending Triangle works best.
1. Trading in a Bullish Market (Best Condition)
A bullish market is the ideal environment for trading an Ascending Triangle Pattern.
Since this pattern is mainly a bullish continuation pattern, it naturally performs better when the overall market trend is already moving upward. Buyers are confident, momentum is positive, and breakout traders are actively looking for buying opportunities.
When the price finally breaks above the resistance with strong volume, it often continues higher because both existing buyers and new buyers enter the market together.
Why It Works Well
- The overall trend supports the breakout.
- Buying momentum is already strong.
- Institutional traders are more likely to participate.
- False breakouts are relatively less common.
What to Look For
- Strong uptrend before the pattern.
- Higher highs and higher lows.
- Increasing volume during the breakout.
- Strong bullish breakout candle.
If all these conditions are present, the Ascending Triangle has a better probability of reaching its target.
2. Trading in a Sideways Market
An Ascending Triangle can also appear during a sideways market, but traders should be more careful.
In a range-bound market, neither buyers nor sellers have complete control. As a result, breakouts may lack momentum and can fail more frequently.
Instead of entering immediately, wait for a clear breakout supported by high trading volume.
Why Extra Confirmation Is Important
In sideways markets, many breakouts turn into false breakouts because there isn’t enough buying pressure to sustain the move.
Waiting for a candle close above resistance and checking the trading volume can improve the quality of your trade.
What to Look For
- Clear resistance level.
- Rising higher lows.
- Strong breakout candle.
- Above-average trading volume.
If the breakout looks weak or volume remains low, it’s usually better to stay out of the trade.
3. Trading in a Bearish Market
Trading an Ascending Triangle during a strong bearish trend is generally not recommended.
Even if the price breaks above the resistance, the overall market trend may continue pushing the price lower. Many bullish breakouts fail because sellers are still controlling the broader market.
Unless there are clear signs that the downtrend is ending, it is usually safer to avoid buying against the trend.
Why It Is Risky
- Overall market sentiment is negative.
- Sellers remain active.
- Bullish breakouts often fail.
- Risk of false breakouts increases.
If you still decide to trade, use a smaller position size and wait for strong confirmation before entering.
Market Condition Comparison
| Market Condition | Reliability | Should You Trade? |
|---|---|---|
| Strong Bullish Trend | ⭐⭐⭐⭐⭐ | Yes, this is the best environment. |
| Sideways Market | ⭐⭐⭐☆☆ | Trade only after strong confirmation. |
| Strong Bearish Trend | ⭐⭐☆☆☆ | Avoid unless there are strong reversal signals. |
Does the Timeframe Matter?
Yes. The reliability of an Ascending Triangle often improves on higher timeframes.
Patterns on the Daily and 4-Hour charts generally carry more weight because they reflect the actions of larger market participants. They also tend to produce fewer false breakouts.
On lower timeframes like the 5-minute or 15-minute chart, the pattern can still work, but market noise is higher. This makes confirmation through volume and candlestick patterns even more important.
Tips for Trading in Different Market Conditions
To improve your trade selection, keep these points in mind:
- Always trade in the direction of the overall trend whenever possible.
- Avoid buying simply because a triangle has formed.
- Look for strong breakout volume before entering.
- Check the broader market sentiment, especially if you’re trading stocks or indices.
- If the market is highly volatile, wait for the breakout candle to close before making a decision.
A good setup in the right market is always better than a perfect-looking setup in the wrong market.
Entry Strategy for the Ascending Triangle Pattern
Identifying an Ascending Triangle is only half the job. The real challenge is knowing when to enter the trade. Entering too early can trap you in a false breakout, while entering too late may reduce your profit potential.
Professional traders don’t predict breakouts—they wait for confirmation. A confirmed breakout gives you a higher probability of success and helps you manage risk more effectively.
There are two popular ways to trade an Ascending Triangle: the Aggressive Entry and the Conservative Entry. Let’s understand both approaches.
1. Aggressive Entry Strategy
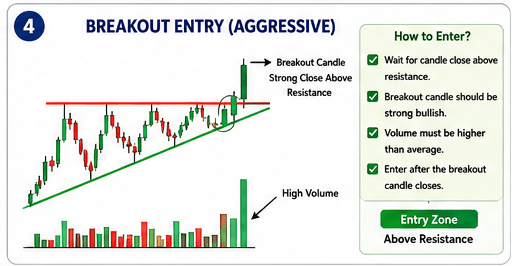
The aggressive entry is suitable for traders who want to catch the breakout as early as possible. In this strategy, you enter the trade immediately after the price breaks above the horizontal resistance with strong momentum.
The key here is confirmation. Don’t buy simply because the price moves above resistance for a few seconds. Wait for the breakout candle to close above the resistance level.
When to Enter
Enter the trade when:
- The breakout candle closes above the resistance.
- The breakout candle is strong and bullish.
- Trading volume is higher than the previous candles.
- The overall market trend is bullish.
A strong breakout candle with high volume usually indicates that buyers have taken control of the market.
Why Traders Choose This Strategy
The biggest advantage of an aggressive entry is that you enter the trade early. This often provides a better entry price and allows you to capture a larger part of the price move.
However, since the breakout has just occurred, there is always a chance that the price may reverse and create a false breakout.
Advantages
- Early entry into the trend.
- Better reward potential.
- Suitable for momentum traders.
- Works well in strong bullish markets.
Disadvantages
- Higher chance of false breakouts.
- Requires quick decision-making.
- Slightly higher trading risk.
Tips for a Better Aggressive Entry
Before placing your order, ask yourself these questions:
✅ Has the candle closed above resistance?
✅ Is the breakout supported by higher volume?
✅ Is the breakout candle large and bullish?
✅ Is the overall market trend positive?
If the answer to all these questions is Yes, the breakout is generally more reliable.
2. Conservative Entry Strategy
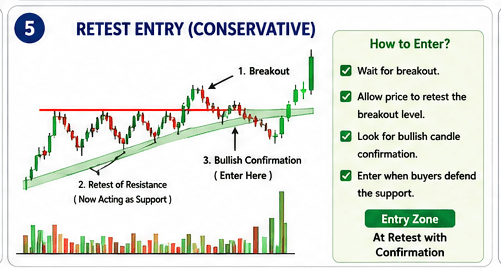
The conservative entry is the preferred choice for many experienced traders because it focuses on confirmation rather than speed.
Instead of buying immediately after the breakout, you wait for the price to return and retest the old resistance level. If that resistance now acts as support and buyers step in again, it confirms that the breakout is genuine.
Only then do you enter the trade.
This approach may cause you to miss a few fast-moving breakouts, but it also helps you avoid many false signals.
When to Enter
Enter the trade when:
- The breakout has already occurred.
- The price retests the breakout level.
- A bullish confirmation candle appears near the support.
- Volume starts increasing again.
This gives you additional confidence before entering the trade.
Why Traders Prefer This Strategy
The retest confirms that buyers are willing to defend the breakout level. Instead of chasing the price, you let the market prove that the breakout is valid.
Many professional traders follow this approach because it reduces unnecessary risk.
Advantages
- Lower probability of false breakouts.
- Better confirmation before entry.
- Easier stop-loss placement.
- Suitable for beginners.
Disadvantages
- Some breakouts never retest.
- Entry price may be slightly higher.
- Patience is required.
Aggressive Entry vs Conservative Entry
| Feature | Aggressive Entry | Conservative Entry |
|---|---|---|
| Entry Time | Immediately after breakout | After breakout and retest |
| Risk Level | Higher | Lower |
| Confirmation | Basic | Strong |
| Reward Potential | Higher | Moderate |
| False Breakout Risk | High | Low |
| Suitable For | Experienced traders | Beginners and swing traders |
Which Entry Strategy Should You Choose?
There is no single strategy that works in every situation. Your choice depends on your trading style and risk tolerance.
- If you are comfortable with higher risk and want to capture the move early, the Aggressive Entry may suit you.
- If you prefer waiting for confirmation and want to reduce the chances of false breakouts, the Conservative Entry is usually the better option.
For most beginners, the conservative approach is a safer way to trade because it encourages patience and discipline.
Common Entry Mistakes to Avoid
Many traders lose money not because the pattern fails, but because they enter the trade too soon.
Avoid these common mistakes:
- Buying before the breakout candle closes.
- Ignoring trading volume.
- Entering when the market trend is bearish.
- Chasing the price after a large breakout candle.
- Taking a trade without any confirmation.
A little patience can often save you from a bad trade.
Quick Checklist Before Entering a Trade
Before you click the buy button, make sure these conditions are met:
- ✅ A valid Ascending Triangle has formed.
- ✅ The breakout candle has closed above resistance.
- ✅ Trading volume has increased.
- ✅ The overall market trend is bullish.
- ✅ Your stop-loss and profit target are already planned.
- ✅ The trade offers a minimum 1:2 Risk-Reward Ratio.
Following this checklist helps remove emotions from your trading decisions and keeps your strategy consistent.