Introduction
Every trader has experienced the frustration of buying too early during a falling market or missing a profitable reversal because there was no clear confirmation. Markets rarely move in a straight line, and identifying the exact point where sellers lose control and buyers regain strength can be challenging. This is where candlestick patterns become valuable, offering insights into market psychology that price alone often cannot reveal.
Among the many candlestick formations used in technical analysis, the Morning Star Candlestick Pattern stands out as one of the most reliable bullish reversal patterns. Professional traders have used it for decades because it clearly illustrates the shift in momentum from sellers to buyers. When this pattern appears after a prolonged downtrend, it often signals that bearish pressure is weakening and a new upward move may be beginning.
However, simply spotting three candles on a chart is not enough. Many beginners assume that every Morning Star guarantees a bullish rally, only to watch the market continue falling. Successful traders understand that the real strength of this pattern comes from combining it with market structure, support levels, trading volume, and confirmation indicators.
In this comprehensive guide, you’ll learn not only how the Morning Star pattern forms but also why it works, how institutional traders interpret it, and how you can use it to improve your trading decisions in stocks, forex, cryptocurrencies, commodities, and indices.
Whether you’re an intraday trader, swing trader, or long-term investor, understanding this pattern can significantly improve your ability to identify high-probability buying opportunities while managing risk effectively.
What Is the Morning Star Candlestick Pattern?
The Morning Star Candlestick Pattern is a three-candle bullish reversal pattern that forms after a noticeable downtrend. It represents the gradual shift from strong selling pressure to increasing buying interest.
The name “Morning Star” symbolizes hope after darkness. Just as the morning star appears before sunrise, this candlestick pattern often appears near the end of a bearish trend, suggesting that a bullish reversal may soon begin.
Unlike single-candle reversal patterns, the Morning Star tells a complete story over three trading sessions. Each candle reflects a different stage of the battle between buyers and sellers.
When the pattern is supported by strong trading volume, a key support zone, or confirmation from technical indicators, it becomes one of the most trusted reversal signals in technical analysis.
Structure of the Morning Star Pattern
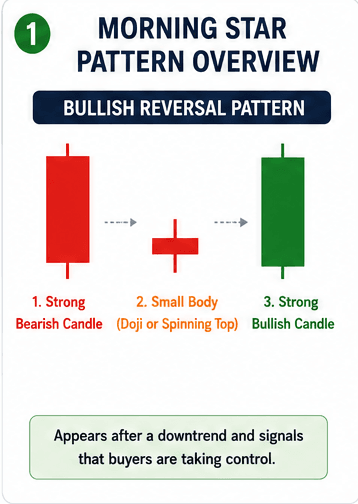
The Morning Star consists of three distinct candles.
First Candle – Strong Bearish Candle
The first candle is a long bearish candle with a relatively large body.
This candle confirms that sellers are firmly in control of the market. Fear dominates sentiment, and many traders continue selling because they believe prices will fall further.
Characteristics:
- Large red candle
- Appears after an established downtrend
- Strong selling momentum
- Bears dominate the market
Second Candle – Small Body Candle
The second candle is much smaller than the first. It may be bullish, bearish, or even a Doji.
This candle represents hesitation. Selling pressure begins to weaken, and buyers quietly start entering the market. Neither side has complete control.
Although this candle may appear insignificant, it is the turning point of the entire pattern, signaling that momentum is changing.
Characteristics:
- Small candle body
- May be green, red, or Doji
- Indicates indecision
- Selling momentum slows
Third Candle – Strong Bullish Candle
The third candle is a large bullish candle that closes well into the body of the first bearish candle.
This candle confirms that buyers have successfully taken control of the market.
Many traders wait for this candle to close before considering a buy trade because it confirms that the reversal is genuine rather than temporary.
Characteristics:
- Large green candle
- Strong buying momentum
- Closes deep inside the first candle
- Confirms bullish reversal
The Psychology Behind the Morning Star Pattern
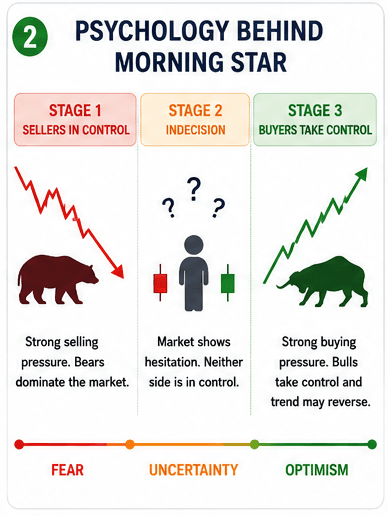
Professional traders don’t simply memorize candlestick shapes—they understand the emotions driving each candle.
The Morning Star pattern is essentially the story of a market changing hands.
Stage 1 – Fear Controls the Market
The first bearish candle reflects panic among sellers. Negative sentiment dominates, and many traders continue exiting positions.
At this point, most market participants believe prices will continue falling.
Stage 2 – Balance Between Buyers and Sellers
The second candle represents uncertainty.
Aggressive sellers begin taking profits, while patient buyers slowly enter at lower prices.
The result is a small-bodied candle showing that neither buyers nor sellers have complete control.
This is often the first warning that the bearish trend may be losing momentum.
Stage 3 – Buyers Regain Control
The third bullish candle changes everything.
Fresh buying demand enters the market, sellers rush to cover their short positions, and confidence begins returning.
The strong bullish close confirms that market sentiment has shifted from fear to optimism.
This transition is why the Morning Star is considered one of the strongest bullish reversal patterns.
Why the Morning Star Pattern Works
The Morning Star works because it reflects real changes in supply and demand rather than random price movement.
During a downtrend, sellers eventually become exhausted. As prices approach attractive valuation levels or significant support zones, institutional investors often begin accumulating positions.
Retail traders usually notice this shift only after the third bullish candle appears.
By understanding this process, traders can participate earlier in potential trend reversals while maintaining disciplined risk management.
However, no candlestick pattern is perfect.
The Morning Star should always be viewed as a probability-based signal, not a guarantee.
Its reliability increases significantly when combined with:
- Major support levels
- High trading volume
- RSI moving out of oversold territory
- Bullish MACD crossover
- Strong market structure
- Confirmation from higher timeframes
Professional traders rarely rely on a single pattern. Instead, they combine several forms of technical evidence before entering a trade.
Where Does the Morning Star Perform Best?
Although the pattern can appear on any financial chart, it generally performs best under the following conditions:
- After a sustained downtrend
- Near long-term support zones
- Around previous demand areas
- At Fibonacci retracement levels
- Following a sharp correction in a broader uptrend
- On higher timeframes such as the 4-hour, daily, and weekly charts
The pattern also works effectively across different markets, including:
- Stocks
- Forex
- Cryptocurrencies
- Commodities
- Stock indices
- Exchange-Traded Funds (ETFs)
Regardless of the market, waiting for confirmation before entering a trade greatly improves the probability of success.
How to Identify a Genuine Morning Star Pattern
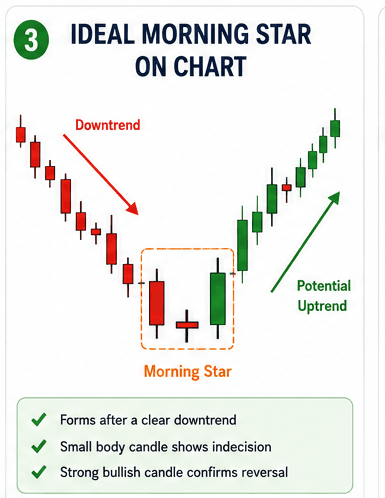
One of the biggest mistakes new traders make is assuming that every three-candle formation is a Morning Star. In reality, many similar-looking patterns fail because they appear in the wrong market conditions or lack proper confirmation.
Professional traders don’t simply look at the candles—they analyze the surrounding market structure before making a trading decision.
To identify a high-quality Morning Star, check the following conditions:
1. The Market Should Be in a Clear Downtrend
The Morning Star is a bullish reversal pattern, so it should only appear after a noticeable price decline. If the market is moving sideways or is already in an uptrend, the pattern loses much of its significance.
A valid downtrend usually consists of:
- Lower highs
- Lower lows
- Strong bearish momentum
- Selling pressure is dominating the market
Without a preceding downtrend, the Morning Star becomes less reliable.
2. The First Candle Should Show Strong Selling Pressure
The first candle should be a large bearish candle with a long body.
This candle confirms that sellers are still controlling the market and that bearish sentiment remains strong.
A small bearish candle does not have the same psychological impact and often yields weaker reversal signals.
3. The Second Candle Should Show Indecision
The second candle should have a relatively small body.
It may be:
- A Doji
- A Small Bullish Candle
- A Small Bearish Candle
- A Spinning Top
The important point is not its colour.
Instead, its small size indicates that selling momentum is slowing and buyers are beginning to challenge the bears.
4. The Third Candle Must Confirm Buyer Strength
This is the most important candle.
A strong bullish candle should close well into the body of the first bearish candle.
The deeper it closes into the first candle, the stronger the reversal signal becomes.
Many experienced traders prefer waiting until this candle closes before entering a trade.
5. Trading Volume Should Increase
Volume plays an important role.
A Morning Star accompanied by increasing buying volume is generally considered more reliable than one formed on low volume.
Higher volume suggests that institutional traders and larger market participants are supporting the reversal.
Step-by-Step Morning Star Trading Strategy
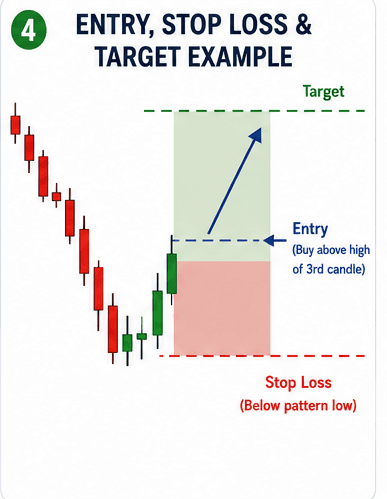
Once a valid Morning Star appears, the next question becomes:
“When should I enter the trade?”
Following a structured trading plan removes emotional decision-making.
Entry Rule
The safest entry is after the third bullish candle has completely closed.
Aggressive traders may enter immediately after the close.
Conservative traders often wait for the price to break above the high of the third candle.
Waiting for confirmation helps reduce false signals.
Stop-Loss Placement
Risk management is more important than finding the perfect entry.
For the Morning Star pattern, common stop-loss locations include:
- Below the lowest point of the pattern
- Below the second candle
- Below a nearby support level
Giving the trade enough room to breathe helps avoid getting stopped out by normal market volatility.
Profit Target
There is no single profit target that works for every trade.
Professional traders typically use one or more of the following methods:
Previous Resistance Level
Exit near the next significant resistance zone.
Risk-to-Reward Ratio
Aim for a minimum ratio of 1:2.
For example:
- Risk = 100
- Target = 200
This allows traders to remain profitable even if only half of their trades succeed.
Trailing Stop
If the market continues trending higher, moving the stop-loss behind higher lows allows traders to maximize profits.
Morning Star with RSI Confirmation
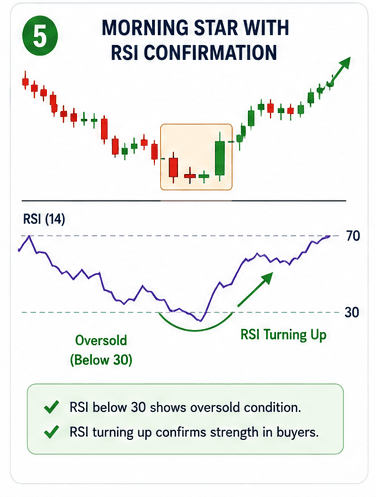
The Relative Strength Index (RSI) is one of the best indicators to combine with the Morning Star.
A strong setup occurs when:
- RSI falls below 30 (Oversold)
- Morning Star appears near support
- RSI begins turning upward
- Third bullish candle confirms buying strength
This combination suggests that selling pressure may be exhausted.
However, remember that RSI should be used as confirmation rather than the primary reason to enter a trade.
Morning Star with MACD
The MACD indicator can further improve trade quality.
A high-probability setup includes:
- Morning Star pattern
- MACD bullish crossover
- Histogram turning positive
- Increasing buying momentum
When both the candlestick pattern and momentum indicator agree, the probability of a successful reversal generally improves.
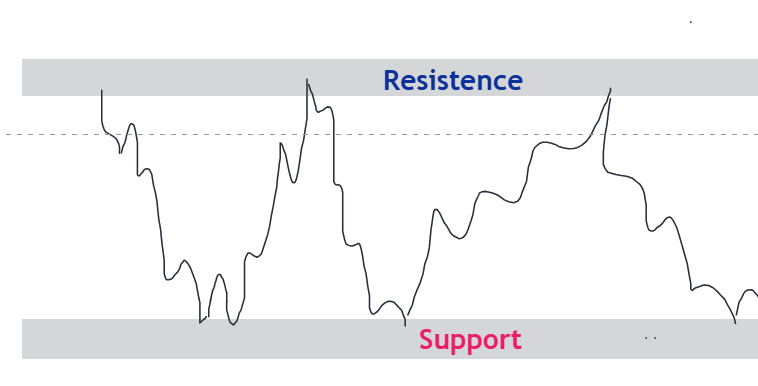
Morning Star with Support and Resistance
Support and resistance remain among the most powerful concepts in technical analysis.
A Morning Star appearing randomly in the middle of a chart is far less meaningful than one forming at an important support level.
Ideal setup:
- Price reaches historical support
- Sellers fail to push lower
- Morning Star appears
- Buyers defend support
- Price begins reversing
This combination often attracts institutional buying.
Morning Star with Volume Analysis
Volume provides insight into the conviction behind price movements.
Look for the following:
- Heavy selling volume during the first candle
- Reduced volume during the second candle
- Strong buying volume during the third candle
This progression indicates that sellers are losing strength while buyers become increasingly active.
Common Mistakes Traders Make
Even experienced traders occasionally misuse candlestick patterns.
Avoid these common mistakes.
Trading Without Confirmation
Never buy simply because three candles resemble a Morning Star.
Always wait for confirmation from price action or technical indicators.
Ignoring the Overall Trend
A Morning Star inside a strong, long-term downtrend may only produce a temporary bounce.
Always check higher timeframes before entering a trade.
Buying Before the Third Candle Closes
Many beginners enter after the second candle.
If the third candle fails to become bullish, the entire pattern becomes invalid.
Patience often improves trade quality.
Ignoring Volume
A reversal supported by strong buying volume carries more weight than one formed on weak participation.
Whenever possible, include volume in your analysis.
Poor Risk Management
Even perfect-looking patterns fail.
Never risk a large portion of your trading capital on a single setup.
Professional traders focus on preserving capital first and growing it second.
Practical Trading Example
Imagine a stock has declined steadily from 1,000 to 880 over several weeks.
As the price approaches a major support zone:
- Day 1 forms a large bearish candle.
- Day 2 forms a small Doji, showing indecision.
- Day 3 forms a strong bullish candle that closes well into the first candle’s body.
Additional confirmation:
- RSI rises from 28 to 35.
- MACD produces a bullish crossover.
- Buying volume increases significantly.
Trade Plan
- Entry: Buy above the high of the third candle.
- Stop-Loss: Below the low of the Morning Star pattern.
- Target 1: Previous swing high.
- Target 2: Next major resistance level.
Instead of relying on a single signal, this trade combines candlestick confirmation, momentum analysis, support, and volume—creating a much stronger trading setup.
Key Takeaways
The Morning Star pattern is not simply three candles on a chart.
It represents a gradual shift in market sentiment from fear to confidence.
The highest-probability setups usually occur when:
- The pattern appears after a strong downtrend.
- It forms near an important support level.
- RSI moves out of oversold territory.
- MACD confirms bullish momentum.
- Buying volume increases.
- Risk management rules are followed.
When these factors align, the Morning Star becomes one of the most dependable bullish reversal patterns available to technical traders.
Advanced Morning Star Trading Strategies Used by Professional Traders
Learning to identify a Morning Star pattern is only the beginning. Professional traders rarely make decisions based on a single candlestick pattern. Instead, they combine it with chart patterns, market structure, support and resistance, volume, and momentum indicators to increase the probability of successful trades.
The following strategies show how the Morning Star can be used in real market conditions.
Morning Star with Double Bottom Pattern
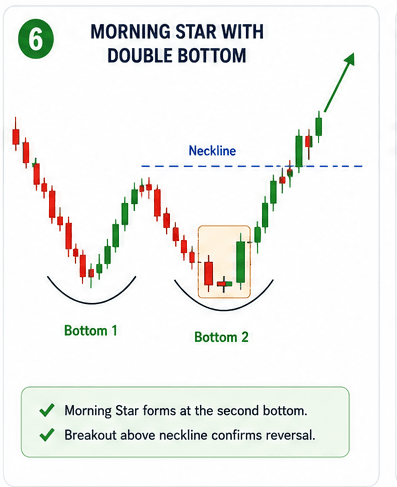
The Double Bottom is one of the strongest bullish reversal chart patterns. It forms when price tests the same support level twice but fails to break below it.
When a Morning Star appears at the second bottom, it provides strong confirmation that buyers are defending the support area.
Trading Setup
- Market is in a clear downtrend.
- Price creates the first bottom and rebounds.
- Price returns to the same support level.
- A Morning Star forms at the second bottom.
- Price breaks above the neckline.
Entry
Buy after the Morning Star is completed or after the neckline breakout.
Stop-Loss
Place the stop-loss below the second bottom.
Target
Measure the distance from the neckline to the bottom and project the same distance upward.
This combination works because the Double Bottom identifies structural support, while the Morning Star confirms that buyers are stepping in.
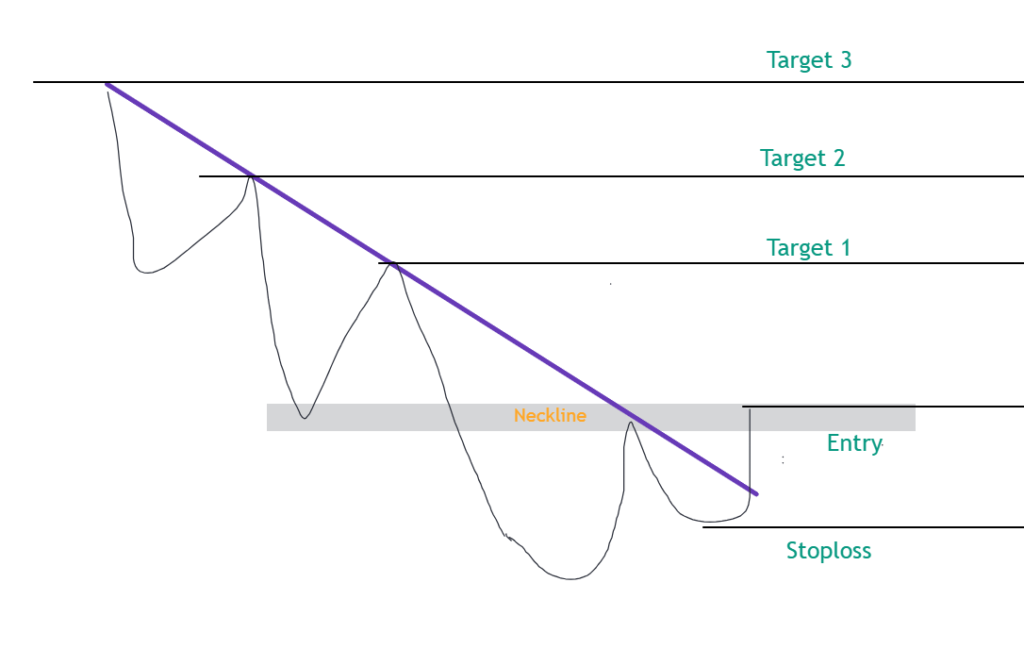
Morning Star with Inverse Head and Shoulders
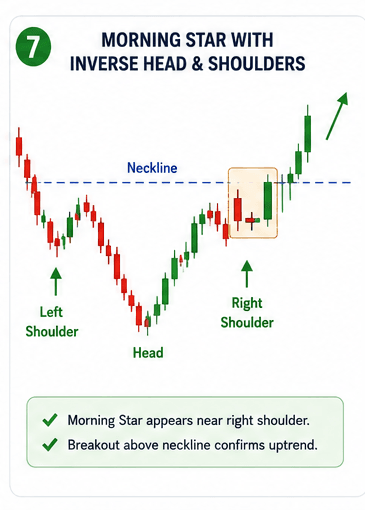
The Inverse Head and Shoulders is another powerful bullish reversal pattern.
Instead of entering immediately after the pattern forms, experienced traders often wait for a Morning Star near the right shoulder.
This provides additional confirmation that the market is ready to reverse.
Trade Flow
- Left shoulder forms.
- Head creates a lower low.
- Right shoulder forms.
- Morning Star appears.
- Neckline breaks.
- Buyers gain momentum.
This combination frequently produces stronger breakouts than relying on either pattern alone.
Morning Star with Trendline Support
Trendlines are simple but highly effective.
If price touches an ascending trendline after a correction and forms a Morning Star, it often indicates that institutional buyers are defending the trend.
The best setups occur when:
- Price touches trendline support.
- Morning Star appears.
- Volume increases.
- RSI begins rising.
This strategy works particularly well in strong bullish markets.
Morning Star with Moving Averages
Moving averages help identify the overall trend.
The Morning Star becomes more reliable when:
- Price finds support near the 50 EMA or 200 EMA.
- A Morning Star forms.
- Price closes above the moving average.
Many swing traders use this strategy to enter trending markets after temporary pullbacks.
Institutional Perspective
Many retail traders believe candlestick patterns alone move the market.
In reality, institutional traders focus on liquidity, order flow, and areas where large numbers of traders are likely to place orders.
The Morning Star often appears because institutions begin accumulating positions near major support levels.
This creates increasing buying pressure while retail traders continue selling.
Eventually, demand exceeds supply, causing the third bullish candle to form.
Understanding this concept helps traders see the Morning Star as evidence of changing market participation rather than simply a three-candle pattern.
Risk Management: The Difference Between Traders Who Last and Those Who Don’t
Even the strongest Morning Star setup can fail.
Professional traders accept this reality and manage risk instead of chasing certainty.
Some practical risk management rules include:
- Never risk more than 1–2% of your trading capital on a single trade.
- Always define your stop-loss before entering.
- Avoid moving the stop-loss further away because of hope.
- Do not average down on losing trades.
- Let profitable trades run while cutting losses quickly.
Consistent profitability comes from disciplined execution rather than trying to win every trade.
Morning Star Trading Checklist
Before entering any trade, ask yourself:
✔ Is the market in a clear downtrend?
✔ Has a genuine Morning Star formed?
✔ Is the pattern near a significant support level?
✔ Is buying volume increasing?
✔ Is RSI moving out of oversold territory?
✔ Has MACD confirmed bullish momentum?
✔ Does the trade offer at least a 1:2 risk-to-reward ratio?
✔ Have you planned your stop-loss and target?
If most of these conditions are met, the setup has a higher probability of success.
When You Should Avoid Trading the Morning Star
The Morning Star is a reliable pattern, but not every appearance deserves a trade.
Avoid taking trades when:
- The market is moving sideways without a clear trend.
- The pattern forms in the middle of a trading range.
- The third candle is weak and lacks bullish momentum.
- Volume remains low throughout the pattern.
- Major economic news or earnings announcements are expected shortly.
- The overall higher-timeframe trend is strongly bearish.
Knowing when not to trade is just as important as knowing when to trade.
Final Thoughts
The Morning Star Candlestick Pattern remains one of the most respected bullish reversal patterns because it reflects a genuine shift in market sentiment.
The first candle shows fear.
The second candle shows hesitation.
The third candle shows confidence returning to the market.
This simple transition makes the Morning Star a valuable tool for identifying potential buying opportunities.
However, successful trading is never about relying on a single pattern.
The best traders combine the Morning Star with support and resistance, chart patterns, volume analysis, RSI, MACD, moving averages, and disciplined risk management.
Remember that every trade is based on probability—not certainty.
Focus on following a consistent process instead of predicting every market movement.
Over time, disciplined execution will produce better results than emotional decision-making.
Master the process, protect your capital, and allow profitable trades to grow naturally.
Frequently Asked Questions (FAQs)
Is the Morning Star pattern bullish or bearish?
It is a bullish reversal pattern that usually appears after a downtrend.
How many candles make a Morning Star?
A Morning Star consists of three candles:
- A strong bearish candle
- A small-bodied candle (or Doji)
- A strong bullish candle
Which timeframe is best for the Morning Star?
The pattern works on all timeframes, but 4-hour, daily, and weekly charts generally provide more reliable signals because they contain less market noise.
Is the Morning Star suitable for beginners?
Yes. It is one of the easiest and most reliable bullish reversal patterns to learn. However, beginners should always wait for confirmation and practice proper risk management.
Which indicators work best with the Morning Star?
The Morning Star performs best when combined with:
- RSI
- MACD
- Volume Analysis
- Support and Resistance
- Moving Averages
- Fibonacci Retracement
- Trendlines
Can the Morning Star be used in stocks, forex, and cryptocurrencies?
Yes. Since the pattern is based on price action, it works across stocks, forex, cryptocurrencies, commodities, indices, and ETFs.
Conclusion
The Morning Star Candlestick Pattern is more than just a visual chart formation—it represents a shift in market psychology from strong selling pressure to growing buying confidence. When traders combine it with chart patterns such as the Double Bottom and Inverse Head and Shoulders, along with confirmation from RSI, MACD, volume, and support levels, it becomes a high-probability trading setup.
No trading strategy guarantees success, but following a structured approach, managing risk carefully, and waiting for multiple confirmations can significantly improve consistency over the long term.