Introduction
Imagine driving a car downhill. Everything seems smooth until you notice the road slowly flattening. The speed begins to decrease, and eventually the car starts moving uphill instead. Markets behave similarly.
A strong uptrend does not reverse instantly. Instead, buyers gradually lose strength while sellers begin taking control. One of the clearest signs of this transition is the Head and Shoulders Pattern.
This pattern is one of the most reliable bearish reversal patterns in technical analysis and is used by professional traders across stocks, forex, commodities, and cryptocurrencies.
In this guide, you’ll learn exactly how to identify the pattern, why it works, how to trade it, and the common mistakes beginners should avoid.
What is the Head and Shoulders Pattern?
The Head and Shoulders Pattern is a bearish reversal chart pattern that appears after a strong uptrend.
It signals that buyers are losing momentum and sellers are gradually gaining control. Once the price breaks below the neckline, traders consider the previous uptrend to be complete and expect a downward move.
Rather than predicting the future with certainty, the pattern highlights a shift in market psychology from optimism to caution.
Why is it Called Head and Shoulders?
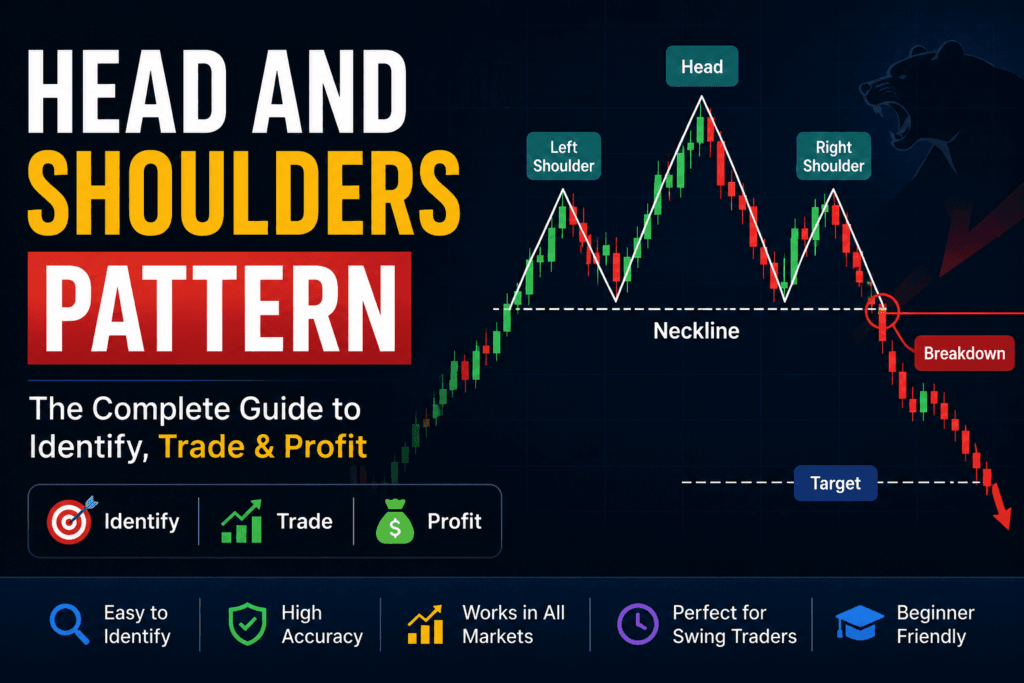
The structure resembles the shape of a person’s head and shoulders.
It consists of:
- Left Shoulder
- Head
- Right Shoulder
- Neckline
The highest peak forms the head, while the two smaller peaks on either side form the shoulders.
Structure of the Pattern
1. Left Shoulder
The market is in an uptrend.
Price makes a new high before experiencing a temporary pullback.
At this stage, buyers are still confident.
2. Head
Buyers push prices to a fresh high, creating the highest point on the chart.
However, after reaching this peak, selling pressure becomes stronger than before.
The correction after the head is usually deeper than the previous pullback.
3. Right Shoulder
Buyers attempt another rally but fail to reach the previous high.
This inability to create a new high is the first warning that bullish momentum is weakening.
4. Neckline
The neckline connects the two swing lows formed after the left shoulder and the head.
This is the most important level in the entire pattern.
A confirmed break below the neckline signals a potential trend reversal.
Types of Necklines
The neckline is one of the most important parts of the Head and Shoulders Pattern. It acts as the support level that must be broken for the bearish reversal to be confirmed.
Horizontal Neckline
A horizontal neckline is formed when both swing lows are at approximately the same price level. This is the easiest type to identify and is commonly seen in textbooks.
Ascending Neckline
An ascending neckline slopes upward because the second swing low is higher than the first. While still valid, traders usually wait for a stronger breakout confirmation.
Descending Neckline
A descending neckline slopes downward as the second swing low is lower than the first. Many traders consider this slightly more bearish because the market is already making lower lows before the breakdown.
Regardless of the neckline’s shape, a confirmed close below it is generally considered more reliable than an intraday price break.
Market Psychology Behind the Pattern
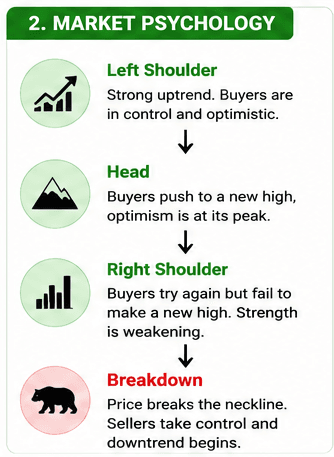
Understanding market psychology helps traders trust the pattern rather than memorizing it.
During the Left Shoulder
Buyers dominate the market.
Everyone expects higher prices.
During the Head
Optimism reaches its peak.
Late buyers enter the market, believing the rally will continue.
Smart money gradually begins booking profits.
During the Right Shoulder
Buyers try once again to push prices higher.
This attempt fails.
Confidence starts fading.
Neckline Breakdown
Once support breaks, many traders exit long positions while short sellers enter.
This creates increased selling pressure.
How to Identify a Valid Head and Shoulders Pattern
A quality pattern generally has the following characteristics:
- Existing uptrend before the pattern forms
- Three clear peaks
- Middle peak is the highest
- Both shoulders are roughly equal
- Clear neckline
- Increased selling volume during breakdown
The cleaner the structure, the more reliable the pattern.
How to Spot False Head and Shoulders Patterns
Not every Head and Shoulders Pattern results in a successful bearish reversal. False breakouts are common, especially in volatile or sideways markets. Learning to identify weak setups can help traders avoid unnecessary losses.
Watch for these warning signs:
- Low volume during the neckline breakdown: A breakout without increased selling volume often lacks conviction and may fail.
- No prior uptrend: The pattern is a reversal pattern, so it should form after a clear and sustained uptrend.
- Uneven shoulders: While perfect symmetry is not required, shoulders that differ significantly in size or shape can reduce the pattern’s reliability.
- Quick recovery above the neckline: If the price falls below the neckline but quickly moves back above it, the breakout may be false.
- Major news events: Unexpected economic announcements or company-specific news can invalidate technical patterns.
Always wait for confirmation instead of entering a trade based solely on the appearance of the pattern.
How to Trade the Head and Shoulders Pattern
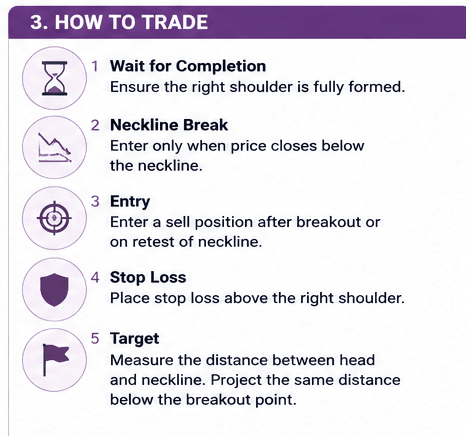
Step 1: Wait for Completion
Never trade before the right shoulder is fully formed.
Premature entries often lead to false signals.
Step 2: Wait for Neckline Break
A trade becomes valid only after the price closes below the neckline.
Avoid entering simply because the pattern “looks complete.”
Step 3: Enter the Trade
Different Entry Strategies
Different traders use different approaches to enter a Head and Shoulders trade depending on their risk tolerance.
Breakout Entry
Aggressive traders enter immediately after the price closes below the neckline. This provides an early entry but also carries a higher risk of false breakouts.
Retest Entry
Conservative traders wait for the price to retest the broken neckline as resistance before entering. Although this approach may miss some trades, it often provides a better risk-to-reward ratio.
Confirmation Entry
Some traders wait for an additional bearish confirmation, such as a strong bearish candlestick or increased selling volume after the retest. This reduces the chances of entering a false breakout.
Step 4: Stop Loss
Place the stop loss above the right shoulder.
This protects against false breakdowns.
Step 5: Profit Target
Measure the vertical distance between:
Head
↓

Neckline
Project the same distance below the breakout point.
This provides the estimated price target.
Example
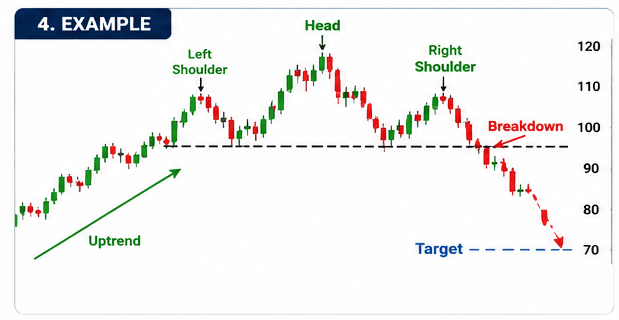
Suppose:
Head = 120
Neckline = 100
Difference = 20
Breakdown occurs at 100.
Expected Target:
₹100 − ₹20 = ₹80
Head and Shoulders Pattern with Fibonacci Confirmation

Step 1: Identify the Pattern
Before entering a trade, confirm that the following conditions are met:
- Left Shoulder is formed.
- Head makes a higher high.
- Right Shoulder fails to make a new high.
- Neckline acts as support.
- Price closes above the neckline (for an inverse Head & Shoulders) or below it (for a regular Head & Shoulders).
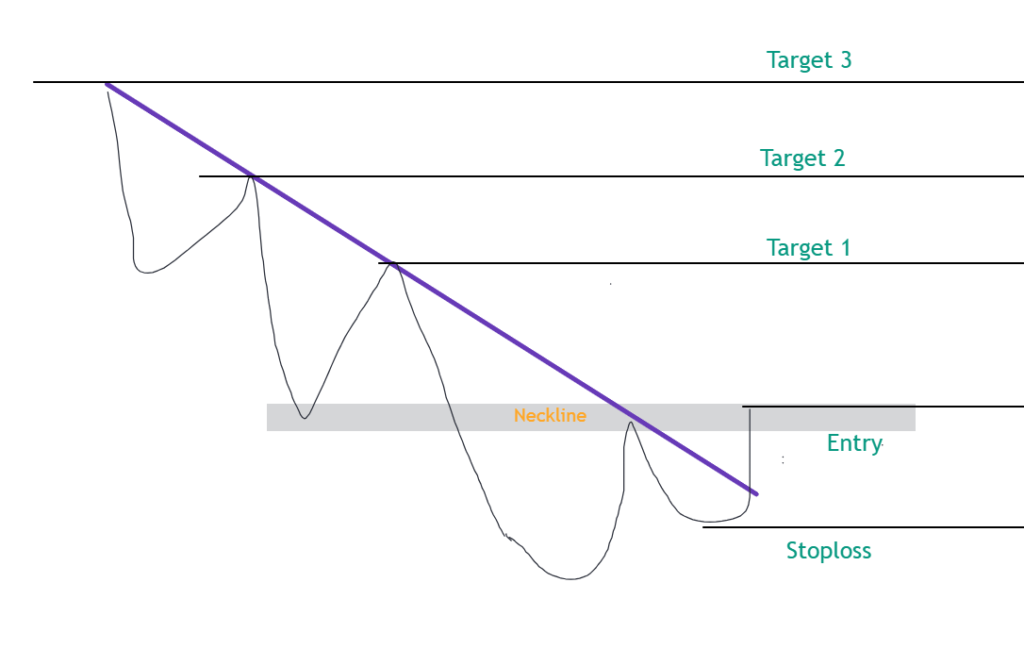
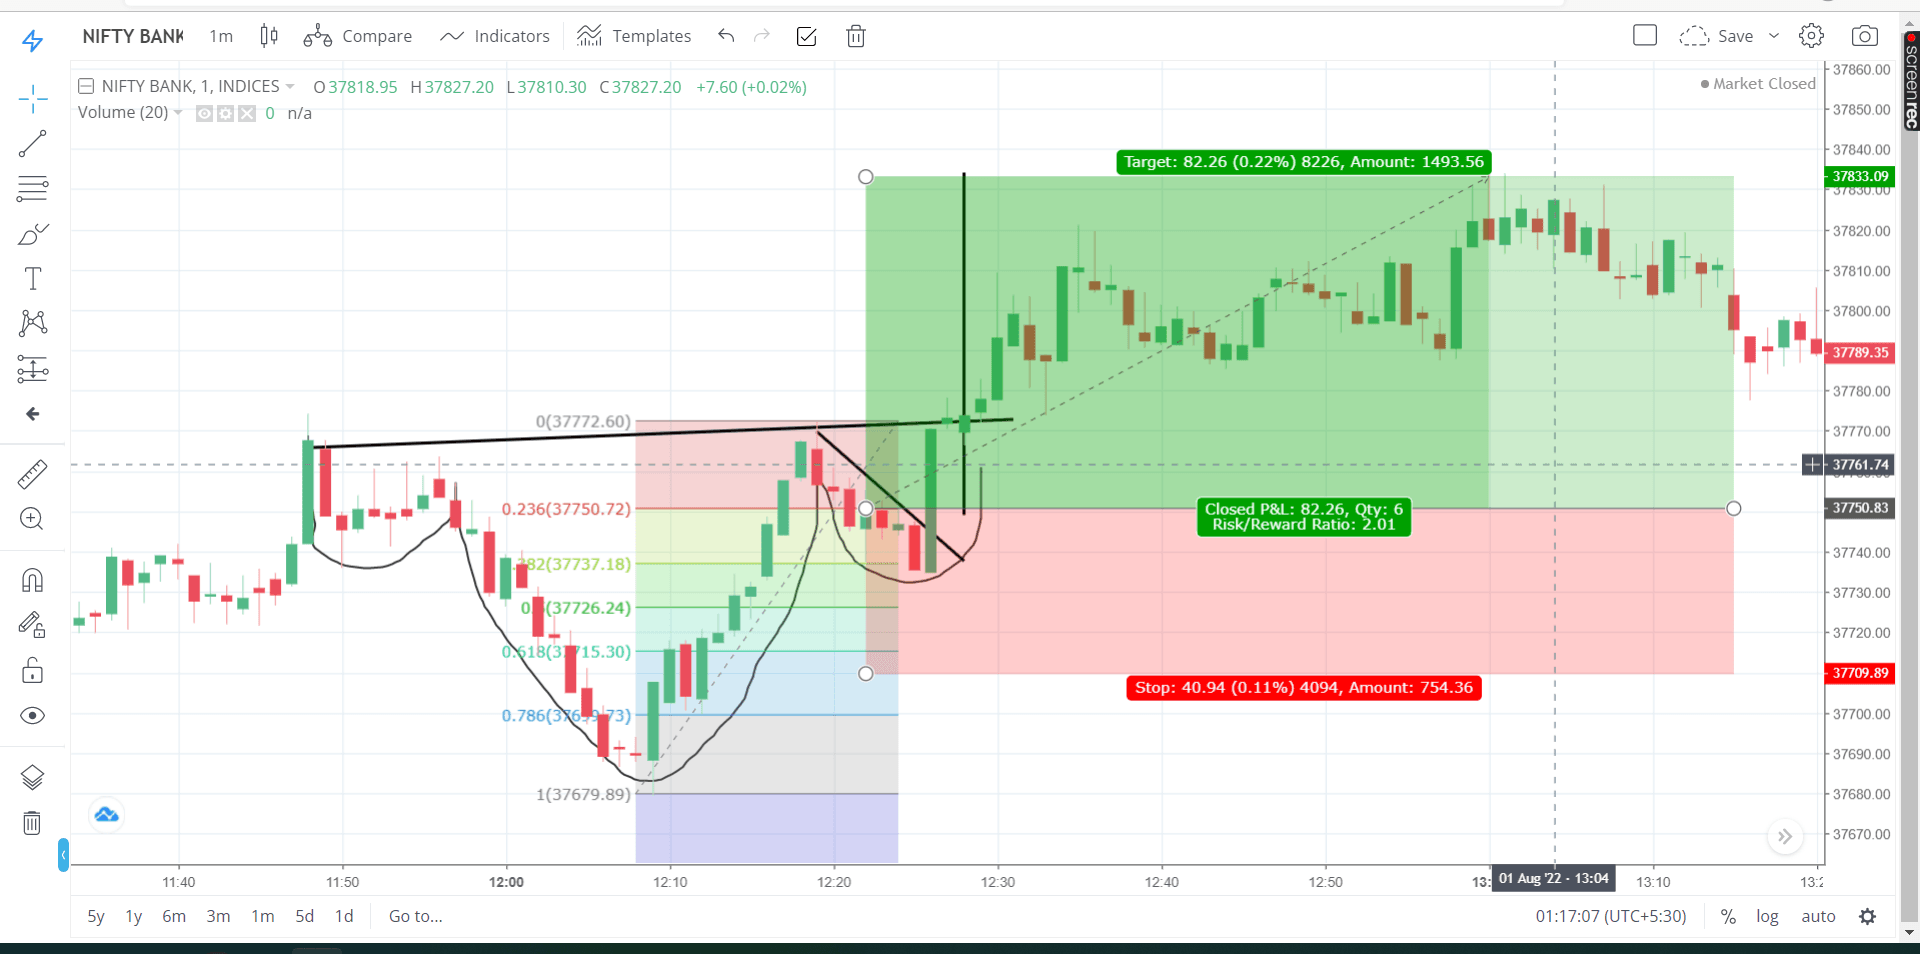
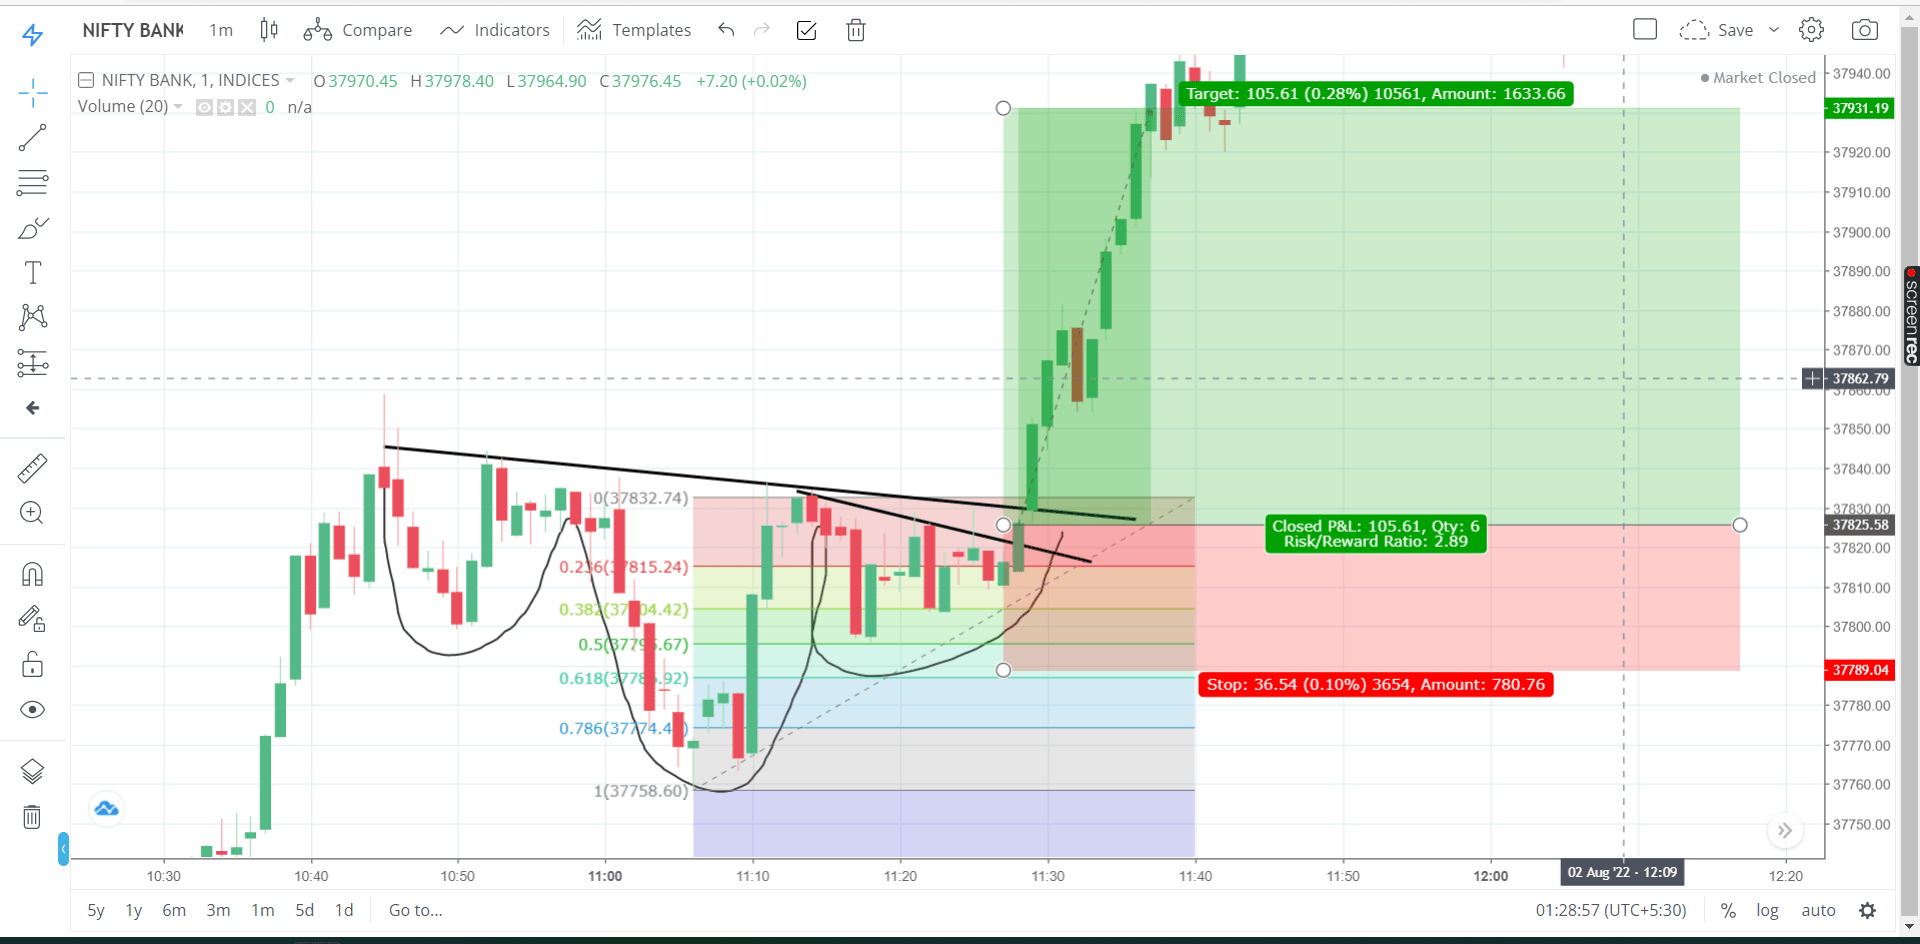
In your chart, the neckline breakout is followed by a pullback into the Fibonacci retracement zone before the strong bullish move.
Step 2: Fibonacci Confirmation
Draw the Fibonacci Retracement from the swing low to the swing high.
The ideal pullback occurs between:
- 38.2%
- 50%
- 61.8% (Golden Zone)
Your chart shows the retracement holding around the 50%–61.8% area before buyers step in.
This provides additional confirmation that the breakout is likely to continue.
Step 3: Entry
Aggressive Entry
Buy immediately after the breakout candle closes above the neckline.
Pros
- Early entry
- Larger profit potential
Cons
- Higher chance of a false breakout
Conservative Entry (Recommended)
Wait for:
- Price to retest the neckline.
- Fibonacci support (50%–61.8%).
- A bullish confirmation candle (Bullish Engulfing, Hammer, Morning Star, etc.).
Entry: Above the high of the bullish confirmation candle.
This is the safer and more reliable approach.
Step 4: Stop Loss
Place the stop-loss:
- Below the 61.8% Fibonacci level, or
- Below the right shoulder low (the safer option).
This protects the trade if the pattern fails.
Step 5: Target
You can use any of these target methods.
Target 1
Measure the distance from:
Head → Neckline
Project the same distance upward from the breakout point.
This is the classic Head & Shoulders price objective.
Target 2
Use Fibonacci Extension levels:
- 127.2%
- 161.8%
These are popular profit targets for trend continuation.
Target 3
Aim for the previous swing high.
If momentum remains strong, trail your stop-loss and let profits run.
Risk-to-Reward
A good trade should offer at least:
- 1 : 2
- Preferably 1 : 3
The setup in your screenshot appears to be close to a 1 : 2.9 risk-to-reward ratio, which is generally considered favorable if all confirmations are present.
Volume Analysis
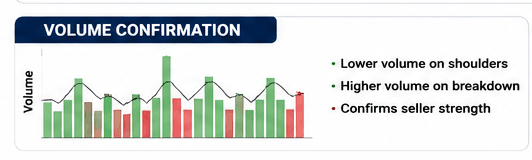
Volume increases the reliability of this pattern.
Typical volume behavior:
- Strong during the uptrend
- Lower near the head
- Even weaker during the right shoulder
- Sharp increase during neckline breakdown
Higher selling volume confirms seller dominance.
Why the Head and Shoulders Pattern Sometimes Fails
Although the Head and Shoulders Pattern is highly respected, it does not guarantee a successful trade.
Some common reasons for failure include:
- Strong institutional buying that absorbs selling pressure.
- Unexpected positive news that changes market sentiment.
- Low trading volume during the breakout.
- High market volatility causing fake breakouts.
- Trading against the overall higher-timeframe trend.
Professional traders understand that even high-quality setups can fail, which is why risk management is always essential.
Advantages
- Easy to identify
- Strong bearish reversal signal
- Works across multiple markets
- Clear entry and exit levels
- Suitable for swing traders
- Effective in price action trading
Disadvantages
- False breakouts can occur
- Requires patience
- Not every pattern reaches its target
- Less reliable in sideways markets
Common Mistakes Beginners Make
Trading Before Confirmation
Many traders enter while the right shoulder is still forming.
Always wait for the neckline break.
Ignoring Volume
A breakout without strong selling volume is less reliable.
Wrong Stop Loss Placement
Keeping the stop loss too close often results in unnecessary exits.
Trading in Sideways Markets
This pattern performs best after a strong uptrend.
Inverse Head and Shoulders Pattern
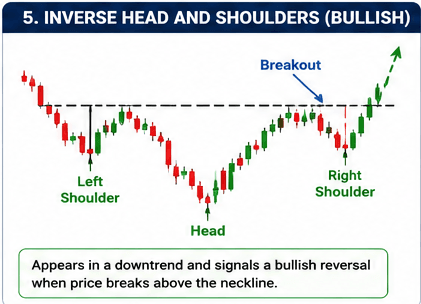
The opposite version is called the Inverse Head and Shoulders Pattern.
Instead of signaling a bearish reversal, it indicates a potential bullish reversal after a downtrend.
Its structure is identical but upside down.
Best Timeframes for Trading
The Head and Shoulders Pattern can appear on any timeframe, but its reliability often improves on higher timeframes.
- 5-Minute Chart: Suitable for scalpers but produces more false signals due to market noise.
- 15-Minute Chart: Popular among day traders looking for short-term opportunities.
- 1-Hour Chart: Offers a good balance between trade frequency and reliability.
- 4-Hour Chart: Preferred by many swing traders because it filters out much of the market noise.
- Daily Chart: Generally provides the strongest and most reliable signals, although trading opportunities occur less frequently.
Choose a timeframe that matches your trading style and always analyze the broader market trend.
Markets Where the Pattern Works Best
The Head and Shoulders Pattern is versatile and can be applied across multiple financial markets.
- Stocks: Frequently used to identify trend reversals in individual company shares.
- Forex: Works well due to the high liquidity of major currency pairs.
- Cryptocurrencies: Effective but requires caution because of increased volatility.
- Commodities: Commonly used in markets such as gold, silver, and crude oil.
- Stock Indices: Helps traders identify potential reversals in broader market trends.
The pattern performs best in liquid markets where price movements are driven by strong buying and selling activity.
Head and Shoulders vs. Double Top
Although both are bearish reversal patterns, they have different structures and trading implications.
The Head and Shoulders Pattern consists of three peaks, with the middle peak (the head) being the highest. It reflects a gradual shift in momentum from buyers to sellers and often provides clearer confirmation through the neckline break.
The Double Top Pattern, on the other hand, consists of only two peaks at approximately the same price level. It is simpler to identify but may generate more false signals if not confirmed by a break below support.
Understanding the difference between these two patterns helps traders avoid misidentifying chart formations.
Best Indicators to Combine
For higher accuracy, combine the pattern with:
- Volume Analysis
- RSI
- Moving Averages
- MACD
- Support and Resistance
- Trendlines
Using multiple confirmations improves trade quality.
Risk Management Tips
Even the best chart patterns fail sometimes.
Professional traders risk only a small portion of their capital on a single trade.
Follow these rules:
- Risk only 1–2% of your capital per trade.
- Always use a stop loss.
- Maintain a minimum 1:2 risk-reward ratio.
- Avoid emotional trading.
Professional Trading Checklist
Before entering a Head and Shoulders trade, review the following checklist:
- ✔ A clear uptrend exists before the pattern begins.
- ✔ Three distinct peaks are visible.
- ✔ The head is higher than both shoulders.
- ✔ The shoulders are reasonably symmetrical.
- ✔ A well-defined neckline is present.
- ✔ The price closes below the neckline.
- ✔ Selling volume increases during the breakdown.
- ✔ The stop loss is placed above the right shoulder.
- ✔ The trade offers a minimum risk-to-reward ratio of 1:2.
- ✔ There are no major economic or company-specific news events that could significantly impact the market.
If multiple conditions are missing, it may be better to wait for a stronger setup.
Pro Tips for Trading the Head and Shoulders Pattern
Experienced traders follow a few simple principles to improve the quality of their trades:
- Never enter before the neckline is broken.
- Always wait for the candle to close below the neckline instead of reacting to intraday price movements.
- Combine the pattern with volume analysis, support and resistance levels, and momentum indicators for stronger confirmation.
- Higher-timeframe patterns are generally more reliable than those on very short timeframes.
- Avoid risking more than 1–2% of your trading capital on a single trade.
- Accept that not every pattern will succeed, and focus on maintaining disciplined risk management rather than trying to predict every market move.
These practices can help improve consistency and reduce emotional decision-making over time.
Frequently Asked Questions (FAQs)
Is the Head and Shoulders Pattern reliable?
Yes. It is considered one of the most reliable bearish reversal patterns when confirmed with volume and a neckline breakdown.
Can beginners trade this pattern?
Yes. It is beginner-friendly because it provides clear entry, stop-loss, and target levels.
Which timeframe is best?
The pattern works on all timeframes, but 1-hour, 4-hour, and Daily charts generally provide stronger signals.
Does it work in cryptocurrency?
Yes. The pattern works in stocks, forex, cryptocurrencies, commodities, and indices.
Final Thoughts
The Head and Shoulders Pattern is more than just three peaks on a chart. It represents a gradual shift in control from buyers to sellers. By waiting for proper confirmation, respecting risk management, and combining the pattern with volume and price action, traders can improve the quality of their decisions.
Remember that no chart pattern guarantees success. Consistent profitability comes from disciplined execution, proper risk management, and continuous learning rather than relying on any single setup.