
Introduction
Imagine trying to drive to a destination without knowing which direction the road is heading. Trading without understanding market structure is the same.
One of the biggest mistakes beginner traders make is entering trades without understanding the market’s overall direction. They buy during downtrends, sell during uptrends, and often get trapped in market reversals.
This is where Market Structure becomes important.
Market structure is the foundation of technical analysis and price action trading. Before learning advanced concepts like liquidity, order blocks, fair value gaps, or Smart Money Concepts (SMC), traders must first understand how prices move.
In this guide, you’ll learn what market structure is, how to identify trends, and how Higher Highs, Higher Lows, Lower Highs, and Lower Lows help traders make better decisions.
What Is Market Structure?
Market structure refers to the way prices move over time by creating highs and lows.
By analyzing these highs and lows, traders can determine whether the market is:
- Trending Up
- Trending Down
- Moving Sideways
Market structure helps answer one critical question:
“Who is currently in control: buyers or sellers?”
If buyers are in control, the market forms bullish structures.
If sellers are in control, the market forms bearish structures.
Understanding this simple concept can dramatically improve your trading decisions.
Why Is Market Structure Important?
Market structure helps traders:
- Identify market trends
- Avoid trading against momentum
- Improve entry timing
- Improve risk management
- Understand institutional market behavior
Professional traders rarely enter a trade before first identifying the market structure.
Understanding Swing Highs and Swing Lows
Before learning market structure, you must understand two important concepts:
Swing High
A swing high is a peak where the price temporarily stops rising and begins moving downward.
It represents an area where sellers gained control.
Swing Low
A swing low is a point where the price temporarily stops falling and begins moving upward.
It represents an area where buyers gained control.
Market structure is built entirely from these swing highs and swing lows.
What Are Higher Highs and Higher Lows?
Higher Highs (HH) and Higher Lows (HL) indicate a bullish market structure.
Higher High (HH)
A Higher High occurs when the price creates a new high above the previous high.
This shows buyers are strong enough to push the market higher.
Higher Low (HL)
A Higher Low occurs when the price retraces but does not fall below the previous low.
This indicates buyers continue to defend lower prices.
Example of a Bullish Market Structure
Higher High
      ↑
      HH
      │
   HL │
      ↓

Previous High
Previous Low
A series of:
- Higher Highs
- Higher lows indicate an uptrend.
This means buyers are in control.
What Are Lower Highs and Lower Lows?
Lower Highs (LH) and Lower Lows (LL) indicate a bearish market structure.
Lower High (LH)
A Lower High forms when the price fails to break the previous high and reverses downward.
This suggests weakening buying pressure.
Lower Low (LL)
A Lower Low occurs when the price falls below the previous low.
This confirms seller dominance.
Example of a Bearish Market Structure
Previous High

      LH
      ↓
      │
      LL
      ↓

Previous Low
A sequence of:
- Lower Highs
- Lower lows indicate a downtrend.
This means sellers are controlling the market.
Types of Market Structure
1. Bullish Market Structure
Characteristics:
- Higher Highs
- Higher Lows
- Strong buying pressure
- Upward momentum
Traders often look for buying opportunities during bullish structures.
2. Bearish Market Structure
Characteristics:
- Lower Highs
- Lower Lows
- Strong selling pressure
- Downward momentum
Traders often look for selling opportunities during bearish structures.
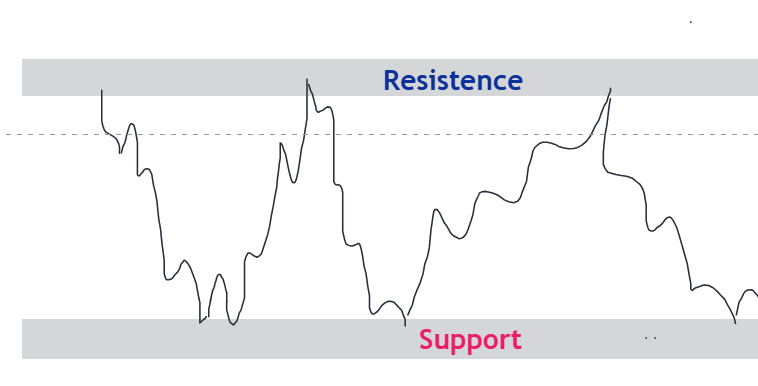
3. Range-Bound Market Structure
Sometimes the market moves sideways.
Characteristics:
- No clear trend
- Equal highs
- Equal lows
- Consolidation
Many false breakouts occur during ranging markets.
How to Identify Market Structure on a Chart
Follow these simple steps:
Step 1: Find Recent Swing Highs
Mark the most recent highs where the price reversed downward.
Step 2: Find Recent Swing Lows
Mark the lows where the price reversed upward.
Step 3: Compare Highs and Lows
Ask:
- Are highs getting higher?
- Are lows getting higher?
If yes, the trend is bullish.
Or:
- Are highs getting lower?
- Are lows getting lower?
If yes, the trend is bearish.
Step 4: Confirm Trend Direction
Never assume.
Wait for multiple confirmations before deciding market direction.
Market Structure and Smart Money Concepts
In Smart Money Concepts (SMC), market structure plays a critical role.
Institutions often create:
- Liquidity Sweeps
- Break of Structure (BOS)
- Change of Character (CHOCH)
- Order Blocks
before making significant moves.
Understanding market structure helps traders recognize these institutional footprints.
For example:
A market may form Higher Highs and Higher Lows.
Suddenly, price breaks a Higher Low.
This could indicate:
- A Change of Character (CHOCH)
- A potential trend reversal
This is why market structure is considered the foundation of Smart Money Trading.
Common Mistakes Traders Make
Ignoring the Trend
Many traders buy during strong downtrends or sell during strong uptrends.
Focusing Only on Indicators
Indicators should support analysis, not replace market structure.
Trading Every Breakout
Not every breakout leads to continuation.
Always analyze the overall structure first.
Ignoring Higher Time Frames
A bullish structure on a 5-minute chart may still be bearish on the 4-hour chart.
Always check multiple time frames.
How Market Structure Improves Trading
Understanding market structure allows traders to:
- Trade with the trend
- Avoid emotional decisions
- Improve trade entries
- Set better stop losses
- Identify potential reversals earlier
Many professional traders rely on market structure before considering any indicator.
Frequently Asked Questions (FAQs)
What is market structure in trading?
Market structure refers to the arrangement of highs and lows on a price chart that helps traders identify trends and market direction.
What is a Higher High?
A Higher High occurs when the price creates a new high above the previous high, indicating bullish momentum.
What is a Lower Low?
A Lower Low occurs when the price falls below the previous low, indicating bearish momentum.
Why is market structure important?
Market structure helps traders understand who controls the market, identify trends, and make better trading decisions.
Is market structure used in Smart Money Concepts?
Yes. Market structure is one of the core foundations of Smart Money Concepts (SMC) and is used alongside BOS, CHOCH, liquidity, and order blocks.
Conclusion
Market structure is one of the most important concepts every trader should master. By understanding Higher Highs, Higher Lows, Lower Highs, and Lower Lows, traders can identify trends, improve trade timing, and avoid trading against market momentum.
Before learning advanced concepts such as liquidity, order blocks, fair value gaps, and Smart Money Concepts, make sure you fully understand market structure. It forms the foundation upon which all successful trading strategies are built.
Remember: Price leaves clues. Market structure helps you read them.