
Introduction
Have you ever looked at a trading chart and wondered how traders predict where the market might move next?
Every day, traders around the world analyze price charts to identify trends, potential reversals, and trading opportunities. Instead of relying solely on news or company financial statements, they study historical price movements and market behavior. This approach is known as Technical Analysis.
Technical analysis is one of the most widely used methods in financial markets. Whether you trade stocks, forex, commodities, cryptocurrencies, or indices, understanding technical analysis can help you make more informed trading decisions.
In this guide, you’ll learn what technical analysis is, how it works, its key principles, and the essential tools every beginner should know.
What Is Technical Analysis?
Technical analysis is the study of historical price movements and trading volume to forecast future market behavior.
Technical analysts believe that all available information is already reflected in the market price. Therefore, instead of focusing on company earnings, economic reports, or financial statements, they analyze charts to identify patterns and trends.
The primary objective of technical analysis is to determine:
- Market direction
- Potential entry points
- Potential exit points
- Risk management levels
Simply put, technical analysis helps traders answer one important question:
“Where is the price likely to move next?”
How Does Technical Analysis Work?
Technical analysis works on the assumption that market participants tend to behave similarly under similar circumstances.
As a result, certain price patterns and market structures often repeat over time.
For example:
- A strong uptrend may continue if buyers remain in control.
- A key support level may attract buyers.
- A resistance level may attract sellers.
- A liquidity sweep may trigger a market reversal.
By studying historical price behavior, traders attempt to identify high-probability trading opportunities.
The Three Core Principles of Technical Analysis
1. The Market Discounts Everything
Technical analysts believe that all known information, including news, economic data, and market sentiment, is already reflected in the current market price.
This means the price itself becomes the most important source of information.
2. Prices Move in Trends
Markets rarely move randomly.
Prices typically move in:
- Uptrends
- Downtrends
- Ranges
One of the primary goals of technical analysis is to identify the current trend and trade in its direction.
3. History Tends to Repeat Itself
Human emotions such as fear and greed remain constant.
Because trader behavior often repeats, similar chart patterns continue to appear throughout market history.
Why Is Technical Analysis Important?
Technical analysis helps traders:
- Identify trends
- Improve trade timing
- Manage risk effectively
- Understand market sentiment
- Find high-probability setups
Without a structured analysis process, traders often make emotional decisions that lead to losses.
Common Tools Used in Technical Analysis
Price Charts
Price charts are the foundation of technical analysis.
The most popular chart types include:
- Line Charts
- Bar Charts
- Candlestick Charts
Most traders prefer candlestick charts because they provide more information about market activity.
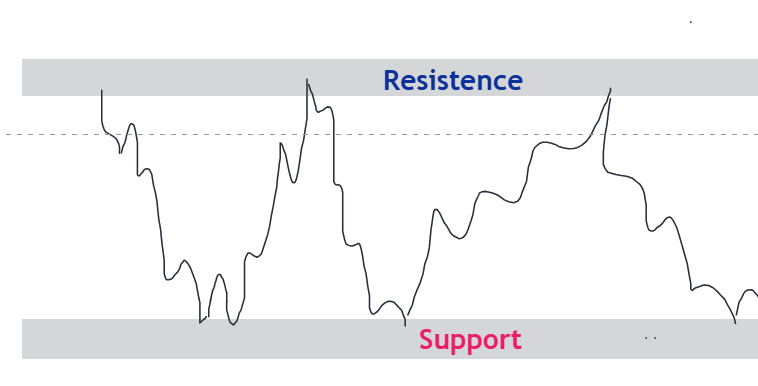
Support and Resistance
Support is an area where buyers may enter the market.
Resistance is an area where sellers may enter the market.
These levels help traders identify potential reversals and breakout opportunities.
Trend Lines
Trend lines help traders visualize market direction.
An upward trend line indicates bullish momentum, while a downward trend line indicates bearish momentum.
Moving Averages
Moving averages help smooth price fluctuations and identify trends.
Popular moving averages include:
- 20 EMA
- 50 EMA
- 200 EMA
Volume
Volume shows the number of transactions occurring within a specific period.
High volume often confirms strong market participation.
Technical Analysis vs Fundamental Analysis
| Technical Analysis | Fundamental Analysis |
|---|---|
| Focuses on price charts | Focuses on financial data |
| Short-term and medium-term | Long-term investing |
| Uses patterns and indicators | Uses earnings and economic reports |
| Identifies entry and exit points | Evaluates asset value |
Many professional traders combine both approaches.
Technical Analysis and Smart Money Concepts
Modern traders often combine traditional technical analysis with Smart Money Concepts (SMC).
SMC focuses on:
- Liquidity
- Order Blocks
- Fair Value Gaps
- Market Structure
- Institutional Behavior
Instead of simply looking at indicators, traders attempt to understand where large institutions may be positioning themselves.
Advantages of Technical Analysis
Easy to Apply
Technical analysis can be used across multiple markets.
Works in Any Market
Stocks, forex, commodities, and cryptocurrencies all follow price action principles.
Helps Manage Risk
Technical analysis allows traders to define stop-loss and take-profit levels.
Provides Clear Trading Frameworks
Traders can develop repeatable strategies based on chart behavior.
Limitations of Technical Analysis
No Method Is 100% Accurate
Markets remain unpredictable.
Different Traders Interpret Charts Differently
A support level identified by one trader may not be viewed the same way by another.
False Signals Can Occur
Not every chart pattern produces the expected outcome.
This is why risk management remains essential.
How Beginners Can Learn Technical Analysis
Step 1: Learn Candlestick Patterns
Understand how buyers and sellers interact through candlesticks.
Step 2: Study Market Structure
Learn concepts such as:
- Higher Highs
- Higher Lows
- Lower Highs
- Lower Lows
Step 3: Understand Support and Resistance
These levels form the foundation of chart analysis.
Step 4: Learn Risk Management
Even the best analysis can fail.
Step 5: Practice Consistently
Use demo accounts and chart replay tools to improve your skills.
Frequently Asked Questions (FAQs)
Is technical analysis suitable for beginners?
Yes. Technical analysis is often the first approach beginners learn because it focuses on understanding price charts.
Does technical analysis work in cryptocurrency markets?
Yes. Technical analysis can be applied to cryptocurrencies, stocks, forex, commodities, and indices.
Is technical analysis better than fundamental analysis?
Neither approach is universally better. Many successful traders combine both methods.
What is the most important concept in technical analysis?
Market structure is one of the most important concepts because it helps traders understand the direction of trends.
Conclusion
Technical analysis is the study of historical price movements to forecast future market behavior. By analyzing charts, trends, support and resistance levels, volume, and market structure, traders can identify potential trading opportunities and manage risk more effectively.
For beginners, technical analysis provides a practical framework for understanding how markets move. As you continue learning, concepts such as liquidity, market structure, order blocks, and price action will help you develop a deeper understanding of the financial markets.