Bullish Engulfing Candle Pattern
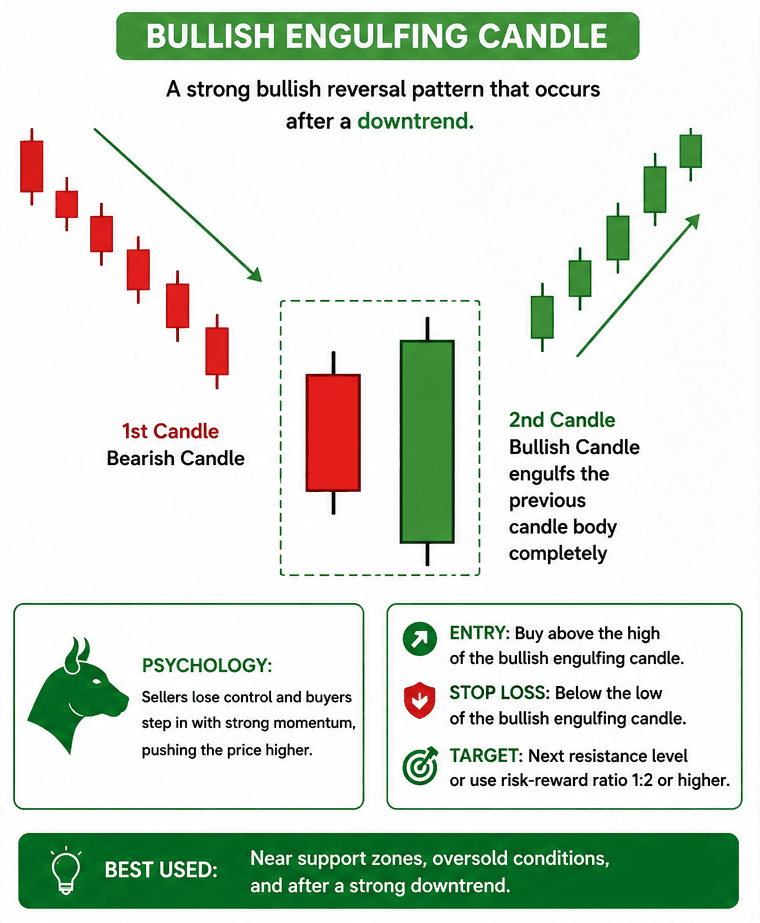
The Bullish Engulfing Pattern is a strong bullish reversal candlestick pattern that appears after a downtrend. It consists of two candles where the second bullish candle completely engulfs the previous bearish candle.
This pattern shows that buyers have taken control from sellers, and the market may move upward.
Key Highlights
- Appears after a downtrend
- Strong buying pressure
- Signals potential trend reversal
- Best used near support zones
Entry
Buy after the bullish engulfing candle closes or when the next candle breaks its high.
Stop Loss
Below the low of the engulfing candle.
Bearish Engulfing Candle Pattern
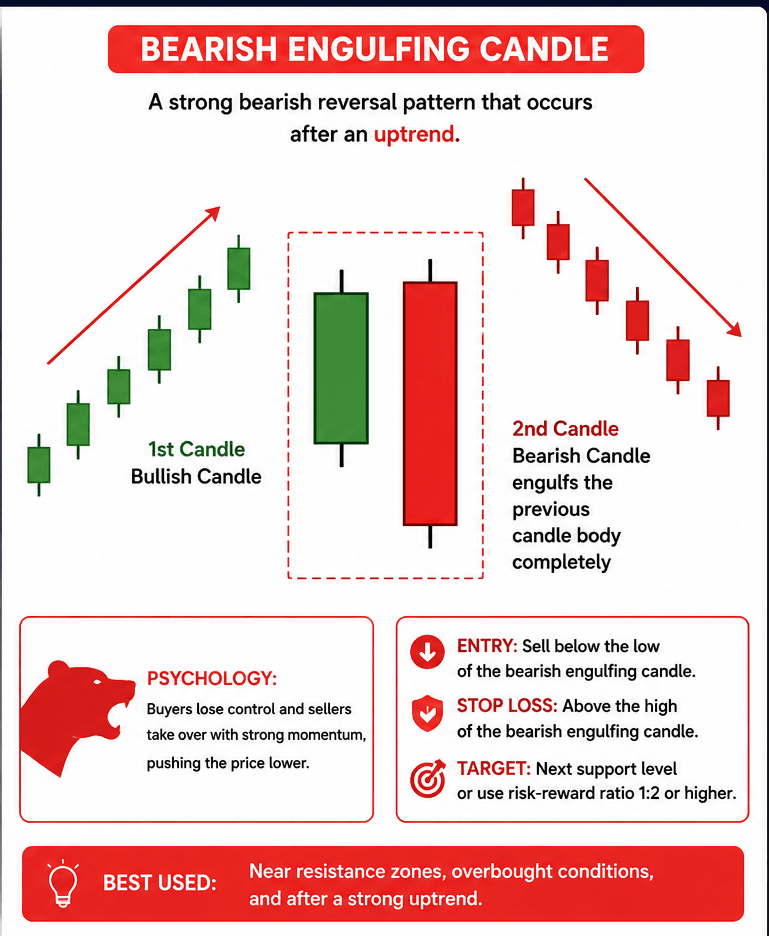
The Bearish Engulfing Pattern is a powerful bearish reversal candlestick pattern that appears after an uptrend. It consists of two candles where the second bearish candle completely engulfs the previous bullish candle.
This pattern indicates strong selling pressure and suggests that sellers may dominate the market.
Key Highlights
- Appears after an uptrend
- Strong selling pressure
- Signals potential downside reversal
- Best used near resistance zones
Entry
Sell after the bearish engulfing candle closes or when the next candle breaks its low.
Stop Loss
Above the high of the engulfing candle.
Professional traders widely use engulfing patterns to identify high-probability reversal setups in price action trading.
Engulfing Candlestick Trading Strategy
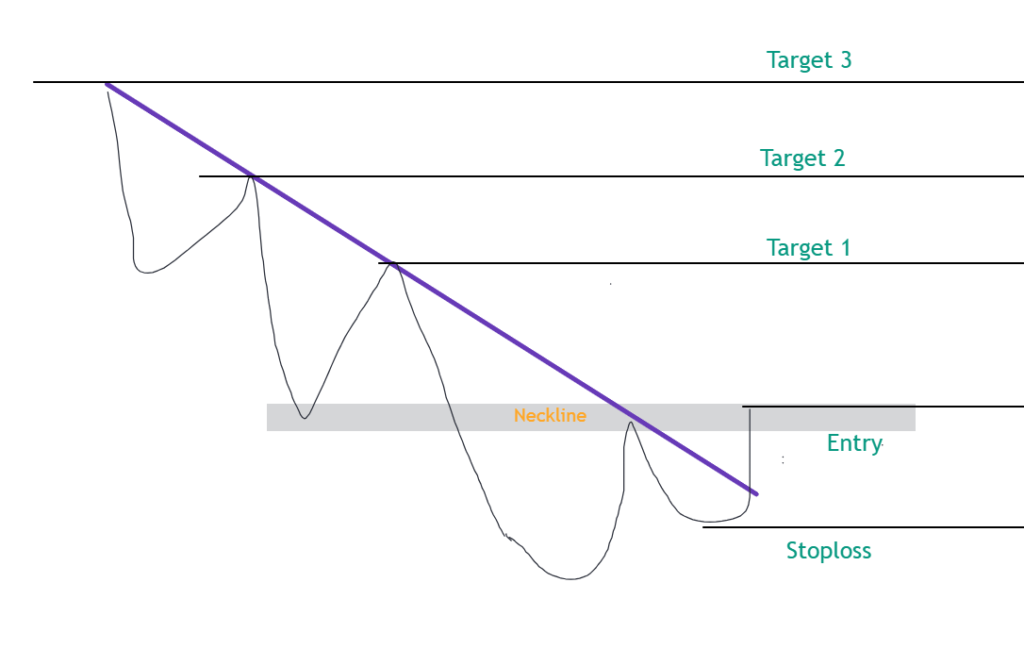
Head and Shoulders Pattern with Bullish Engulfing Candle Confirmation
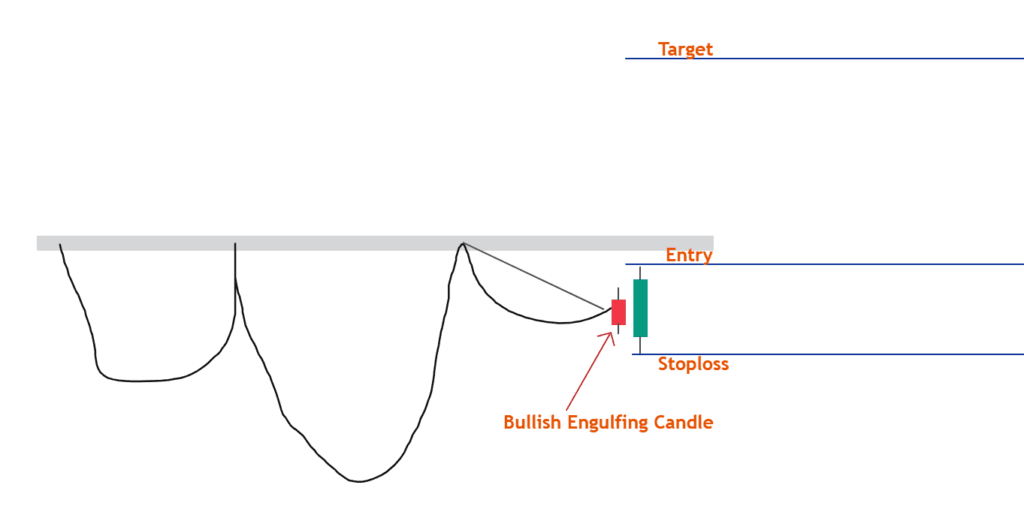
The Head and Shoulders Pattern is a powerful bullish reversal pattern that signals a potential shift from bearish to bullish. In this setup, the bullish engulfing candle provides strong confirmation for a buying opportunity after the neckline retest.
Entry Strategy
A buy entry is taken when the price retests the neckline support area and forms a strong bullish engulfing candle. This confirms that buyers are defending the breakout level and gaining market control.
Entry Confirmation
- Neckline breakout occurs
- Price retests the neckline
- Bullish engulfing candle forms
- Buy above the high of the engulfing candle
This confirmation helps traders avoid false breakouts and increases trade probability.
Stop Loss
The stop loss should be placed below the low of the bullish engulfing candle or slightly below the neckline support zone.
This protects the trade from unexpected market reversals and maintains proper risk management.
Target Strategy
The target is usually calculated using the measured move method.
Target Methods
- Previous resistance level
- Head to neckline measured move
- Minimum 1:2 Risk-Reward Ratio
Traders can also use a trailing stop loss to maximize profits during strong bullish momentum.
Why This Setup Works
This strategy combines:
- Market structure
- Breakout confirmation
- Retest confirmation
- Bullish engulfing candle psychology
The bullish engulfing candle confirms that buyers have taken control after the retest, making the setup more reliable for swing and intraday trading.
Pro Tip
The strongest trades occur when:
- Volume increases during a breakout
- Bullish engulfing candle closes strongly
- Higher timeframe trend supports the setup
- RSI shows bullish momentum
Professional price action traders widely use this setup for high-probability bullish reversal trades.
Head and Shoulders Pattern with Bearish Engulfing Candle Confirmation
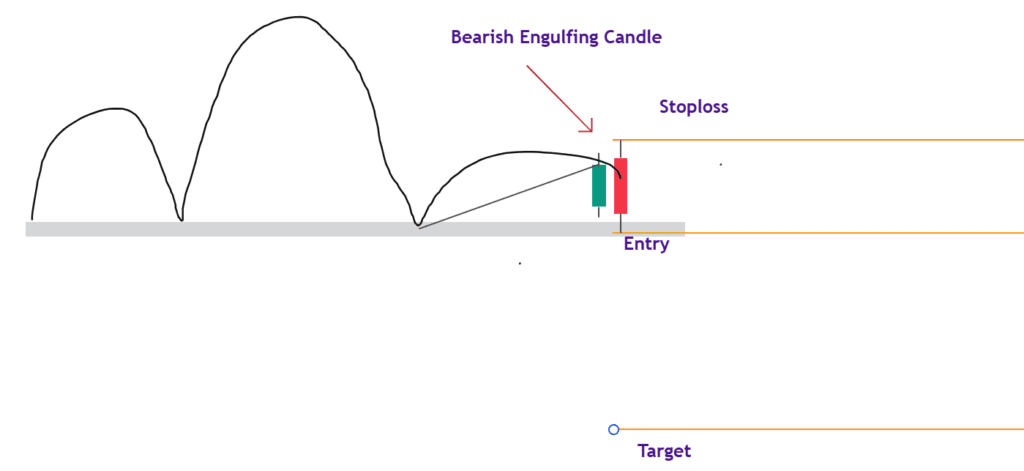
The Head and Shoulders Pattern is one of the most reliable bearish reversal patterns in technical analysis. In this setup, the bearish engulfing candle confirms strong selling pressure near the neckline retest area, providing a high-probability sell opportunity.
Entry Strategy
A sell entry is taken when the price retests the neckline support zone and forms a strong bearish engulfing candle. This confirms that sellers are taking control after the retest.
Entry Confirmation
- Head and Shoulders pattern forms
- Price breaks the neckline
- Market retests the neckline resistance
- Bearish engulfing candle appears
- Enter sell below the low of the engulfing candle
This confirmation helps traders avoid false breakdowns and improve trade accuracy.
Stop Loss
The stop loss should be placed above the high of the bearish engulfing candle or above the neckline resistance area.
This protects the trade from sudden bullish reversals and maintains proper risk management.
Target Strategy
The target is usually calculated using the measured move method.
Target Methods
- Previous support level
- Head to neckline measured move
- Minimum 1:2 Risk-Reward Ratio
Traders can also trail the stop loss as the price moves downward to maximize profits.
Why This Setup Works
This strategy combines:
- Market structure
- Neckline breakdown confirmation
- Retest confirmation Bearish engulfing candle psychology
The bearish engulfing candle confirms strong seller dominance after the retest, making the setup highly effective for intraday and swing trading.
Pro Tip
The strongest setups occur when:
- Volume increases during the breakdown
- Bearish engulfing candle closes strongly
- RSI shows bearish divergence
- Higher timeframe trend supports the bearish move
Professional price action traders widely use this setup for identifying high-probability bearish reversal trades.
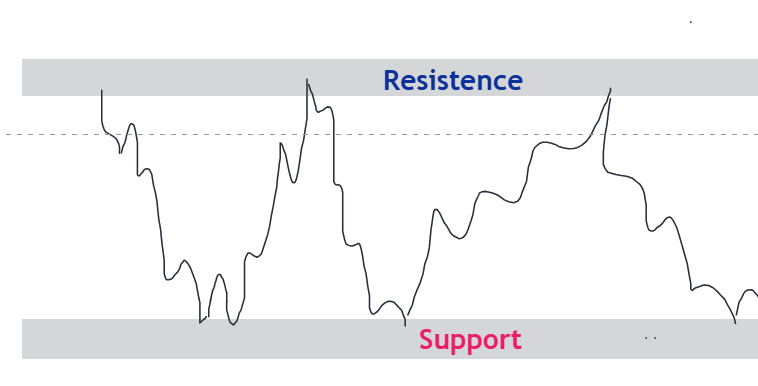
Double Bottom Pattern with Bullish Engulfing Candle Confirmation
The Double Bottom Pattern is a strong bullish reversal pattern that appears after a downtrend. It indicates that sellers are losing momentum and buyers are starting to take control of the market.
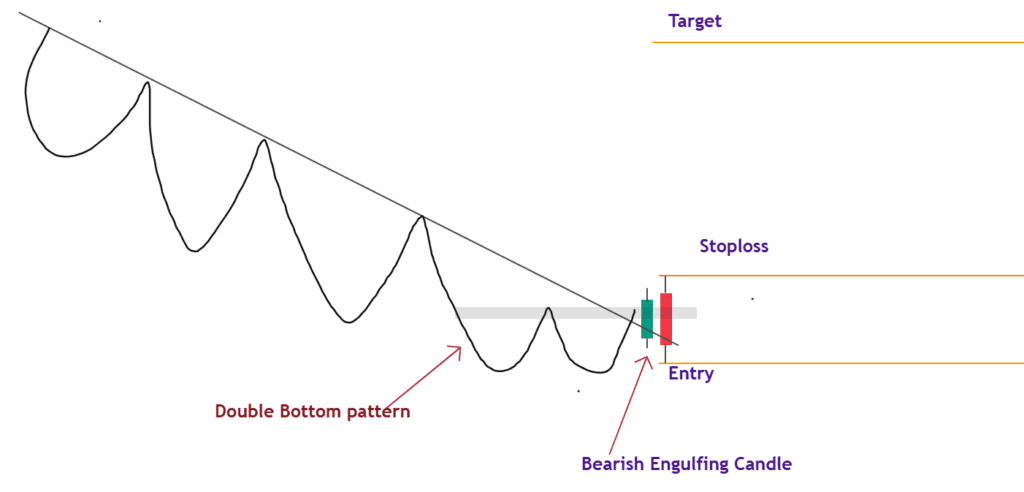
In this setup, the bullish engulfing candle acts as a confirmation signal near the support zone, providing a high-probability buying opportunity.
Entry Strategy
A buy entry is taken when the price forms a double bottom structure and a bullish engulfing candle appears near the neckline or support retest area.
Entry Confirmation
- Double Bottom pattern forms
- Price respects the support zone
- A bullish engulfing candle appears
- Enter buy above the high of the engulfing candle
This confirmation helps traders avoid false reversals and improve trade accuracy.
Stop Loss
The stop loss should be placed below the low of the bullish engulfing candle or below the support area.
This helps protect the trade from unexpected downside movement and maintains proper risk management.
Target Strategy
The target can be calculated using:
- Previous resistance level
- Double Bottom measured move
- Minimum 1:2 Risk-Reward Ratio
Traders can also use a trailing stop loss to maximize profits during strong bullish momentum.
Why This Setup Works
This strategy combines:
- Double Bottom market structure
- Strong support confirmation
- Bullish engulfing candle psychology
- Price action confirmation
The bullish engulfing candle confirms that buyers have gained strength after the support reaction, increasing the probability of a bullish reversal.
Pro Tip
The strongest setups occur when:
- Volume increases during a breakout
- Bullish engulfing candle closes strongly
- Higher timeframe trend supports the move
- RSI shows bullish divergence
Professional price action traders widely use this setup for identifying high-probability bullish reversal trades.
Double Top Pattern with Bearish Engulfing Candle Confirmation
The Double Top Pattern is one of the most reliable bearish reversal patterns in technical analysis. It usually forms after an uptrend and signals that buyers are losing momentum while sellers are starting to dominate the market.
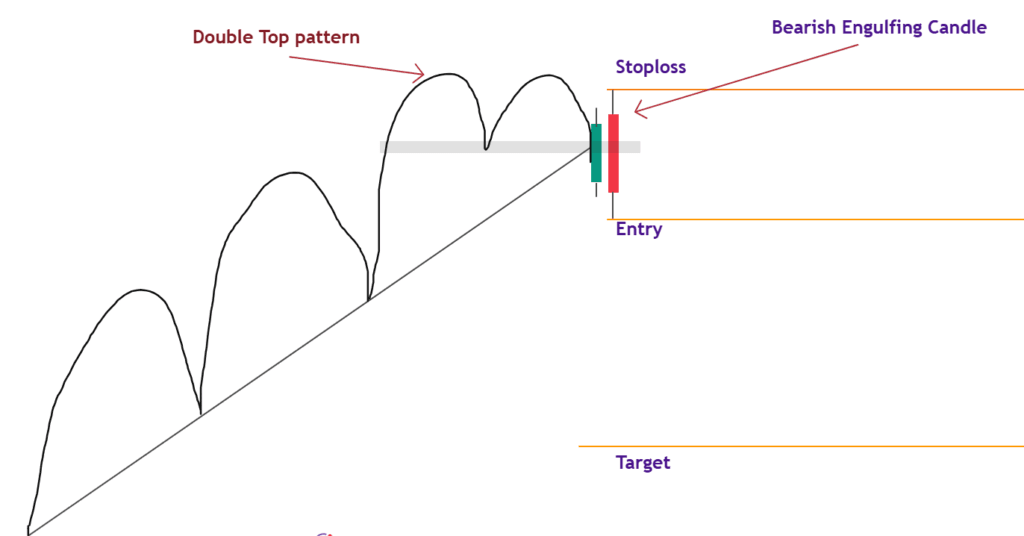
In this setup, the bearish engulfing candle provides strong confirmation for a sell entry near the resistance zone.
Entry Strategy
A sell entry is taken when the price forms a double top structure and a bearish engulfing candle appears near the resistance or neckline rejection area.
Entry Confirmation
- Double Top pattern forms
- Price rejects the resistance zone
- Bearish engulfing candle appears
- Enter sell below the low of the engulfing candle
This confirmation helps traders avoid false breakouts and improves trade accuracy.
Stop Loss
The stop loss should be placed above the high of the bearish engulfing candle or above the resistance area.
This protects traders from unexpected bullish breakouts and helps maintain proper risk management.
Target Strategy
The target can be planned using:
- Previous support level
- Double Top measured move
- Minimum 1:2 Risk-Reward Ratio
Traders can also trail their stop loss as the price moves downward to maximize profits.
Why This Setup Works
This strategy combines:
- Double Top market structure* Resistance rejection
- Bearish engulfing candle psychology
- Price action confirmation
The bearish engulfing candle confirms strong seller dominance near resistance, increasing the probability of a bearish reversal.
Pro Tip
The strongest setups occur when:
- Volume increases during rejection* Bearish engulfing candle closes strongly
- RSI shows bearish divergence
- Higher timeframe trend supports the bearish move
Professional price action traders widely use this setup for identifying high-probability bearish reversal trades.
Advantages of Engulfing Candlestick Patterns
The Engulfing Pattern is one of the most popular price action signals used by traders worldwide.
Key Advantages
✔ Easy to identify on any chart
✔ Works in stocks, forex, commodities, and crypto markets
✔ Provides early reversal signals
✔ Can be combined with support and resistance levels
✔ Suitable for intraday, swing, and positional trading
✔ Helps traders find high-risk-reward opportunities
Limitations of Engulfing Candlestick Patterns
Although engulfing patterns are powerful, they should not be used alone.
Key Limitations
✔ Can generate false signals in sideways markets
✔ Less reliable without confirmation
✔ Market news can invalidate the setup
✔ Low-volume patterns may fail
✔ Risk management is still necessary
Common Mistakes Traders Make
Many traders lose money because they trade engulfing patterns incorrectly.
Common Mistakes
❌ Trading without trend confirmation
❌ Ignoring support and resistance zones
❌ Entering before the candle closes
❌ Not using a stop loss
❌ Ignoring volume confirmation
❌ Risking too much on a single trade
Best Indicators to Combine with Engulfing Patterns
Using confirmation tools can improve trade accuracy.
RSI (Relative Strength Index)
A bullish engulfing pattern with RSI showing oversold conditions increases the probability of a bullish reversal.
A bearish engulfing pattern with RSI showing overbought conditions increases the probability of a bearish reversal.
Volume
Higher trading volume during the engulfing candle confirms strong buyer or seller participation.
Support and Resistance
Bullish engulfing patterns work best near support zones.
Bearish engulfing patterns work best near resistance zones.
Moving Averages
A bullish engulfing pattern above the 50 EMA often signals trend continuation.
A bearish engulfing pattern below the 50 EMA often signals trend weakness.
Frequently Asked Questions (FAQs)
What is an Engulfing Candlestick Pattern?
An engulfing candlestick pattern is a two-candle reversal pattern where the second candle completely engulfs the body of the previous candle.
Is the Engulfing Pattern Reliable?
Yes, it is considered one of the most reliable reversal patterns when combined with volume, support and resistance, and trend analysis.
Which Timeframe Is Best for Engulfing Patterns?
Engulfing patterns work on all timeframes, but 1-hour, 4-hour, and Daily charts generally provide stronger signals.
Can Beginners Trade Engulfing Patterns?
Yes. The pattern is easy to identify and is commonly used by beginner and professional traders.
What Is the Success Rate of the Engulfing Pattern?
The success rate depends on market conditions and confirmation tools. Proper risk management is always essential.
Conclusion
The Bullish and Bearish Engulfing Patterns are powerful price action reversal signals that help traders identify potential trend changes. When combined with support and resistance, volume analysis, and proper risk management, engulfing patterns can provide high-probability trading opportunities.
Professional traders use engulfing patterns not as standalone signals but as confirmation tools within a complete trading strategy. By waiting for confirmation and following strict risk management rules, traders can improve consistency and avoid false signals.