Introduction
The financial market is a constant battle between buyers and sellers. Every price movement reflects the emotions, expectations, and decisions of millions of market participants. While individual candlesticks provide valuable information, candlestick patterns often reveal a much clearer picture of the market’s future direction. Among the many bullish reversal patterns used by traders worldwide, the Three White Soldiers stands out as one of the most reliable and powerful.
The Three White Soldiers candlestick pattern appears after a prolonged downtrend and indicates that buyers have gradually taken control from sellers. It consists of three consecutive bullish candlesticks, each closing higher than the previous one. This steady upward movement reflects increasing buying pressure and a significant shift in market sentiment.
Unlike many candlestick patterns that can generate false signals, the Three White Soldiers pattern demonstrates sustained bullish momentum over three trading sessions. This makes it particularly valuable for swing traders, positional traders, and long-term investors who seek high-probability trend reversal opportunities.
However, identifying the pattern alone is not enough. Professional traders understand that every successful trade depends on multiple factors, including market context, support and resistance levels, trading volume, indicator confirmation, and proper risk management. Learning the psychology behind the pattern helps traders distinguish genuine reversal signals from temporary price fluctuations.
In this comprehensive guide, you will learn how the Three White Soldiers pattern forms, why it works, what market psychology drives its formation, and how professional traders use it to identify profitable trading opportunities.
What Is the Three White Soldiers Candlestick Pattern?
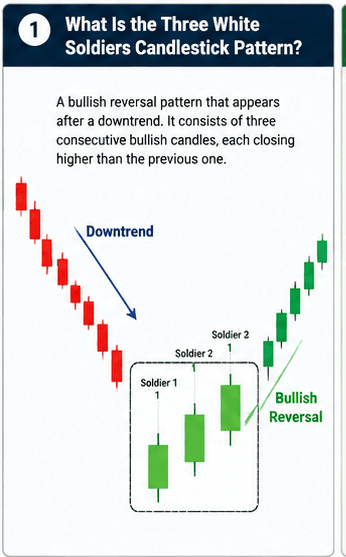
The Three White Soldiers is a bullish reversal candlestick pattern that forms after a noticeable downtrend. It consists of three consecutive bullish candlesticks, each opening within or near the body of the previous candle and closing above the previous candle’s closing price.
The pattern signals that buying pressure has consistently increased over three trading sessions, indicating that sellers are losing control while buyers are becoming more aggressive.
Originally developed as part of Japanese candlestick charting techniques, the pattern earned its name because bullish candles were traditionally represented in white. Although modern trading platforms usually display bullish candles in green, the name “Three White Soldiers” continues to be used by traders around the world.
The formation represents more than just three rising candles. It reflects a gradual transfer of market control from bears to bulls. As confidence among buyers grows and selling pressure weakens, the probability of a bullish trend reversal increases significantly.
When combined with strong volume, support levels, and technical indicators, the Three White Soldiers pattern becomes one of the most dependable reversal signals in technical analysis.
Why Is It Called the Three White Soldiers?
The name originates from traditional Japanese candlestick analysis, where bullish candles were colored white.
Imagine three disciplined soldiers marching forward together on a battlefield.
The first soldier successfully breaks through the enemy’s defensive line.
The second soldier advances further, proving that the initial breakthrough was genuine.
The third soldier secures the battlefield by establishing complete control over the opposing forces.
The stock market behaves in a remarkably similar way.
The first bullish candle interrupts the prevailing downtrend.
The second bullish candle confirms that buying pressure continues to strengthen.
The third bullish candle demonstrates that buyers have fully taken control, increasing the likelihood of a sustained upward trend.
The pattern symbolizes confidence, discipline, and the gradual strengthening of bullish momentum.
How to Identify the Three White Soldiers Pattern
Correctly identifying the Three White Soldiers pattern is essential because many similar-looking formations fail to produce reliable reversal signals. Professional traders evaluate several characteristics before considering the pattern valid.
Characteristics of a Valid Three White Soldiers Pattern
A high-quality Three White Soldiers pattern should satisfy the following conditions.
It Must Appear After a Downtrend
The pattern should always develop after a clear bearish trend or an extended price correction.
If the market is already moving upward, the pattern no longer represents a reversal and therefore loses much of its significance.
The longer and stronger the preceding downtrend, the more meaningful the pattern becomes.
Three Consecutive Bullish Candles
The formation consists of three strong bullish candles appearing one after another.
Each candle should close higher than the previous candle, demonstrating consistent buying pressure.
This steady progression reflects growing confidence among buyers.
Large Real Bodies
The candles should have relatively large bodies compared to recent candles.
Large bodies indicate decisive buying activity and show that buyers remained in control throughout most of the trading session.
Small-bodied candles generally represent uncertainty and reduce the reliability of the pattern.
Small Lower Shadows
Ideally, each bullish candle should have a small or almost invisible lower wick.
Small lower shadows indicate that sellers were unable to push prices significantly lower during the trading session.
This reflects strong buyer dominance.
Each Candle Opens Within the Previous Candle’s Body
The opening price of each new candle should occur within or very close to the body of the previous bullish candle.
This demonstrates healthy continuation rather than excessive price gaps.
Large gaps may indicate abnormal market conditions rather than steady institutional buying.
Each Candle Closes Near Its High
Strong bullish candles usually close near the highest price of the trading session.
This indicates that buyers maintained control until the market closed and sellers were unable to regain momentum.
Closing near the session high strengthens the reliability of the pattern.
Common Mistakes While Identifying the Pattern
Many beginner traders incorrectly identify ordinary bullish candles as the Three White Soldiers pattern. Avoiding these common mistakes can significantly improve trading accuracy.
Trading Without a Prior Downtrend
The biggest mistake is identifying the pattern during an existing uptrend.
Since the pattern is designed to signal a bullish reversal, it must always appear after a bearish phase.
Without a previous decline, the pattern simply represents trend continuation rather than reversal.
Ignoring Candle Size
Three small bullish candles do not necessarily qualify as Three White Soldiers.
The candles should display meaningful buying strength with clearly visible real bodies.
Weak candles often reflect market indecision rather than genuine bullish momentum.
Ignoring Resistance Levels
Even a perfect Three White Soldiers pattern can fail if it forms immediately below a strong resistance zone.
Resistance often attracts fresh selling pressure, limiting the upside potential.
Always evaluate nearby support and resistance before entering a trade.
Ignoring Trading Volume
Volume provides valuable confirmation.
A pattern accompanied by increasing volume demonstrates genuine buying interest.
Declining volume during the pattern may indicate weak participation and increase the risk of failure.
Assuming Every Pattern Will Succeed
No candlestick pattern guarantees future price movement.
Professional traders always combine the pattern with additional confirmation tools such as trend analysis, momentum indicators, and proper risk management.
Psychology Behind the Three White Soldiers Pattern
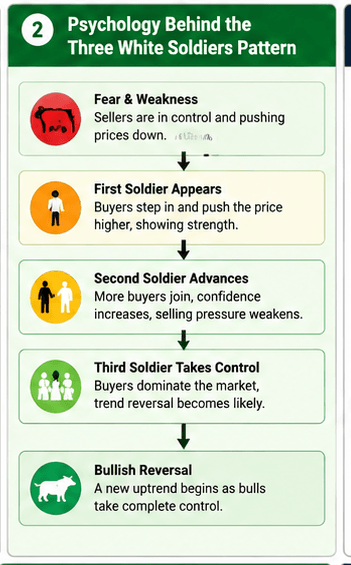
The true strength of the Three White Soldiers pattern lies in the psychology behind its formation. Understanding why the pattern develops helps traders recognize high-quality opportunities instead of relying solely on visual recognition.
Every candlestick reflects the collective emotions of buyers and sellers. The Three White Soldiers pattern tells the story of fear gradually giving way to confidence.
Stage 1: Sellers Dominate the Market
Before the pattern forms, the market has usually been declining for several trading sessions or weeks.
Negative sentiment dominates investor thinking.
Many traders believe prices will continue falling.
Long-term investors hesitate to buy.
Retail traders become fearful and often sell near market bottoms.
At this stage, sellers control the market and bearish sentiment appears overwhelming.
Stage 2: Selling Pressure Begins to Fade
Every trend eventually reaches a point where the majority of sellers have already exited their positions.
As selling pressure decreases, prices stop falling as aggressively as before.
Although market sentiment remains negative, experienced traders begin noticing that the downward momentum is weakening.
This stage often represents the early accumulation phase.
Stage 3: Smart Money Starts Buying
Institutional investors, mutual funds, hedge funds, and experienced traders often recognize attractive valuations before retail investors.
Instead of purchasing all their shares at once, they accumulate positions gradually.
This controlled buying prevents dramatic price increases while steadily reducing available supply.
Retail traders frequently overlook this quiet accumulation phase.
Stage 4: The First Bullish Candle Changes Expectations
Eventually, buying demand becomes strong enough to absorb remaining selling pressure.
The first large bullish candle appears.
Psychologically, this creates uncertainty among bearish traders.
Some sellers begin questioning whether the downtrend is losing strength.
Aggressive buyers recognize the shift and start building positions.
Short sellers become cautious.
Although confidence is still limited, the first bullish candle represents the earliest warning that market conditions may be changing.
Stage 5: The Second Bullish Candle Builds Confidence
The second bullish candle strengthens the bullish argument.
Instead of reversing lower, buyers continue purchasing shares and push prices even higher.
At this point:
- More traders recognize the improving momentum.
- Short sellers begin covering their positions.
- Momentum traders prepare for possible breakout opportunities.
- Confidence among buyers continues increasing.
The market gradually transitions from pessimism toward cautious optimism.
Stage 6: The Third Bullish Candle Confirms Buyer Dominance
The third bullish candle completes the pattern and confirms that buyers have gained control.
By now:
- Institutional buying becomes more noticeable.
- Remaining short sellers rush to exit their trades.
- Retail traders begin entering long positions.
- Market sentiment shifts from fear to optimism.
This psychological transition is the primary reason why the Three White Soldiers pattern often marks the beginning of a new bullish trend rather than simply producing a temporary price bounce.
Why Does the Three White Soldiers Pattern Form?
Understanding why the pattern forms helps traders distinguish strong reversal setups from ordinary market noise.
Sellers Become Exhausted
Every downtrend eventually weakens as most traders who wanted to sell have already exited their positions.
With fewer sellers remaining, buyers require less effort to push prices higher.
This reduction in selling pressure creates favorable conditions for a bullish reversal.
Attractive Prices Encourage Buying
As prices decline, fundamentally strong stocks often become undervalued.
Long-term investors recognize these opportunities and begin gradually accumulating shares.
Their consistent buying demand contributes to the formation of consecutive bullish candles.
Short Covering Accelerates the Rally
Many traders profit during a downtrend by selling shares short.
However, every short position must eventually be closed by buying back the shares.
When prices begin rising unexpectedly, short sellers rush to cover their positions, creating additional buying pressure that strengthens the bullish move.
Institutional Accumulation
Large financial institutions rarely purchase their full positions in a single trading session.
Instead, they accumulate shares over several days to avoid driving prices sharply higher.
This gradual accumulation often produces the steady progression of three consecutive bullish candles seen in the Three White Soldiers pattern.
Shift in Market Sentiment
The most significant reason behind the pattern is the change in trader psychology.
Initially, fear dominates the market.
After three strong bullish sessions, confidence begins replacing pessimism.
More traders believe that the worst of the decline is over, leading to increased buying activity and reduced selling pressure.
This transition from bearish sentiment to bullish optimism often marks the beginning of a sustainable upward trend.
How to Trade the Three White Soldiers Pattern
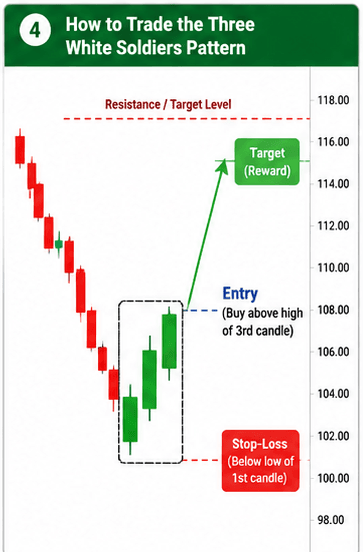
Identifying the Three White Soldiers pattern is only the first step. The real challenge is knowing when to enter the trade, where to place the stop-loss, how to set a realistic target, and how to manage risk throughout the trade.
Many beginner traders make the mistake of buying immediately after spotting three bullish candles. While the pattern is a strong bullish reversal signal, entering without confirmation can result in false breakouts and unnecessary losses.
Professional traders always wait for confirmation before entering a position. They combine the pattern with support and resistance levels, trading volume, and technical indicators to increase the probability of success.
In this section, you’ll learn a step-by-step trading strategy that can be applied to stocks, indices, forex, commodities, and cryptocurrencies.
Entry Strategy
The entry point determines the risk and reward of every trade. Even a strong candlestick pattern can fail if the trade is entered too early.
Professional traders generally use one of three entry methods.
Entry Method 1: Breakout Entry (Most Reliable)
This is the safest and most commonly used method.
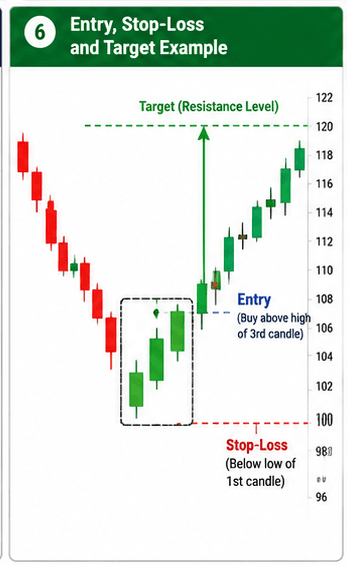
Wait for the third bullish candle to close completely. Enter the trade only when the next candle breaks above the high of the third candle.
This confirms that buyers are still active and that the bullish momentum is continuing.
Why It Works
A breakout above the third candle’s high indicates that buyers are willing to pay even higher prices. It also reduces the chances of entering during a temporary price bounce.
Suitable For
- Swing Trading
- Positional Trading
- Beginners
- Conservative Traders
Entry Method 2: Closing Price Entry
Some experienced traders enter immediately after the third bullish candle closes.
This method provides an earlier entry and usually offers a better risk-reward ratio.
However, it carries slightly higher risk because the breakout has not yet been confirmed.
Suitable For
- Experienced Traders
- Momentum Trading
Entry Method 3: Pullback Entry
Instead of chasing the price, some traders wait for a small pullback after the pattern forms.
The price often retests the high or body of the third candle before continuing higher.
Buying during this pullback provides:
- Lower risk
- Better entry price
- Improved risk-reward ratio
This strategy requires patience because not every pattern offers a pullback.
Stop-Loss Placement
A stop-loss protects your trading capital if the market moves against your position.
Professional traders never enter a trade without defining their exit point in advance.
Method 1: Below the First Candle (Recommended)
Place the stop-loss below the low of the first bullish candle.
This method allows enough room for normal market fluctuations while protecting against major trend reversals.
This is the most reliable stop-loss placement.
Method 2: Below the Entire Pattern
Place the stop-loss slightly below the lowest price of all three candles.
This technique works well when the pattern forms near a major support level.
Method 3: Below Recent Swing Low
Some traders prefer placing the stop-loss below the previous swing low.
This approach is suitable when the pattern develops after a prolonged downtrend.
Profit Target
Determining the correct profit target is just as important as choosing the right entry.
Many traders lose potential profits because they exit too early.
Professional traders use several methods.
Target Method 1: Next Resistance Level
The safest target is the nearest resistance level.
Since resistance often attracts selling pressure, booking partial profits here is a sensible strategy.
Target Method 2: Fixed Risk-Reward Ratio
Many professional traders simply use predefined risk-reward ratios.
Examples include:
- 1:2
- 1:3
- 1:4
If risking ₹100, the minimum expected reward should be at least ₹200.
Target Method 3: Trailing Stop-Loss
Instead of using a fixed target, traders can trail their stop-loss as the price moves higher.
This strategy allows profits to grow while protecting gains.
It is particularly effective during strong bullish trends.
Target Method 4: Moving Average Exit
Some traders remain in the trade until the price closes below an important moving average such as the 20 EMA.
This allows participation in longer trends.
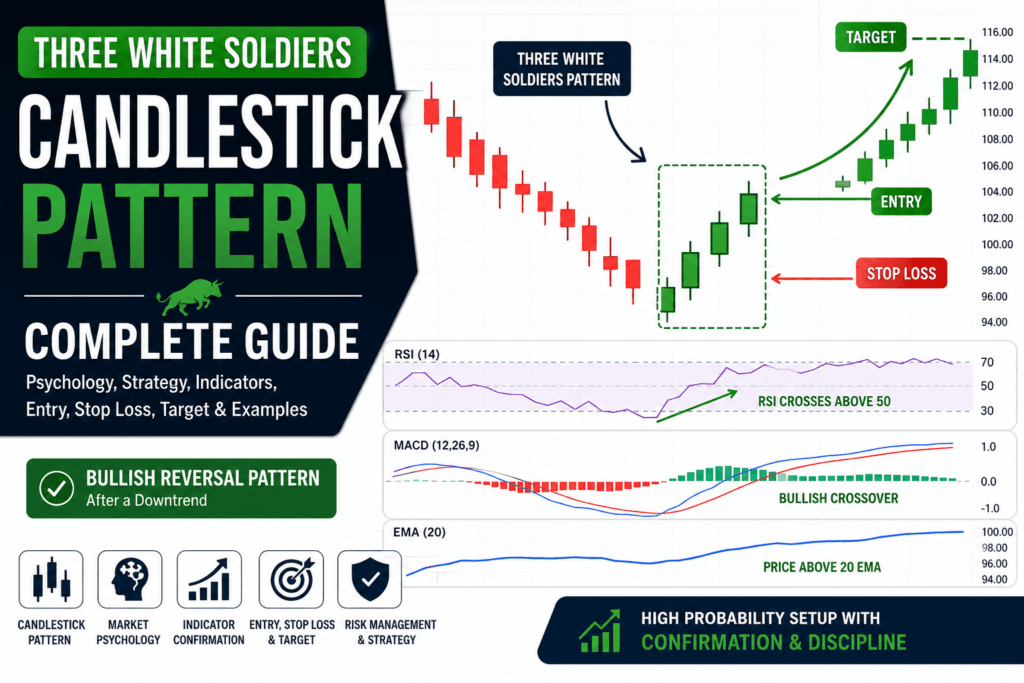
Entry, Stoploss and Target Example
Trade Management
Entering a trade is only the beginning. Managing the trade correctly determines long-term success.
Professional traders follow these principles:
- Never move the stop-loss further away to avoid a loss.
- Consider booking partial profits at the first resistance level.
- Trail the stop-loss as the trend develops.
- Avoid emotional decisions based on intraday price fluctuations.
- Stick to the trading plan unless market conditions change significantly.
Consistent trade management often makes the difference between profitable and losing traders.
Best Market Conditions to Trade the Pattern
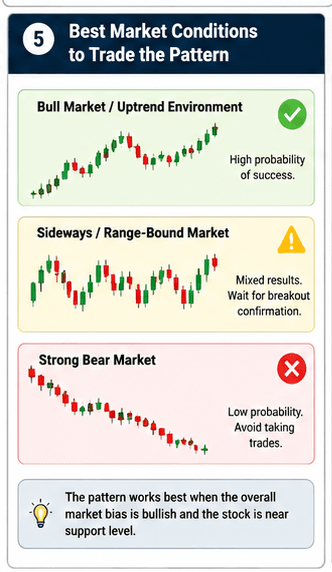
The effectiveness of the Three White Soldiers pattern depends heavily on the overall market environment.
Understanding when the pattern works best helps traders avoid low-probability trades.
Trading in a Bullish Market (Best Condition)
A bullish market provides the highest probability of success.
During an uptrend, temporary pullbacks are common. When the Three White Soldiers pattern forms after one of these pullbacks, it often signals the continuation of the larger trend.
Why It Works
The overall trend already favors buyers.
Institutional investors are more likely to continue accumulating positions.
Buying pressure remains strong.
Momentum traders actively participate.
Trading Strategy
- Wait for the pattern near a support level.
- Confirm with increasing volume.
- Enter above the third candle.
- Use the previous swing low as the stop-loss.
- Target the next resistance level.
Success Probability: ★★★★★
Trading in a Sideways Market (Trade with Confirmation)
Sideways markets are more challenging.
Prices often fluctuate within a defined range, producing frequent false breakouts.
The Three White Soldiers pattern can still work if it forms near the lower boundary of the range.
Why It Works
The lower boundary acts as support.
Buyers often become active near support zones.
However, resistance remains nearby, limiting profit potential.
Trading Strategy
- Buy only after a confirmed breakout above the range.
- Confirm using RSI or MACD.
- Keep realistic profit targets.
Success Probability: ★★★☆☆
Trading in a Bearish Market (Avoid Unless Strong Confirmation Exists)
A bearish market is the least favorable environment.
Although the Three White Soldiers pattern indicates a reversal, the broader trend still favors sellers.
Many bullish reversals fail because strong downtrends often resume after temporary rallies.
When Can It Be Traded?
Only consider trading if:
- The pattern forms at a major historical support level.
- Volume increases significantly.
- RSI indicates oversold conditions.
- MACD gives a bullish crossover.
- The price breaks above an important resistance level.
Without these confirmations, it is generally better to avoid long trades.
Success Probability: ★★☆☆☆
Trading Success Comparison
| Market Condition | Reliability | Recommendation |
|---|---|---|
| Strong Bullish Trend | Excellent | Best Environment |
| Pullback in Uptrend | Excellent | Highly Recommended |
| Sideways Market | Moderate | Trade with Confirmation |
| Weak Downtrend | Moderate | Wait for Breakout |
| Strong Bearish Trend | Low | Avoid Unless Strong Confirmation Exists |
Professional Trading Checklist
Before entering a trade, ask yourself the following questions:
✅ Has the pattern formed after a clear downtrend or pullback?
✅ Are all three bullish candles strong with large real bodies?
✅ Is trading volume increasing?
✅ Is the pattern forming near an important support level?
✅ Is there sufficient room before the next resistance?
✅ Does the risk-reward ratio meet at least 1:2?
✅ Has the breakout above the third candle been confirmed?
If the answer to most of these questions is Yes, the trade has a higher probability of success.
Common Entry Mistakes
Even experienced traders occasionally make mistakes. Beginners should avoid these common errors:
Buying Too Early
Entering before the third candle closes can expose traders to false signals.
Ignoring Resistance
Buying directly below a major resistance level often results in limited upside.
Chasing Overextended Prices
If the price has already moved significantly after the pattern forms, the risk-reward ratio may no longer be favorable.
Ignoring the Overall Trend
Trading against a strong bearish trend without confirmation reduces the probability of success.
Trading Without a Stop-Loss
No candlestick pattern is 100% accurate. A predefined stop-loss is essential to protect trading capital.
Best Indicators for Confirming the Three White Soldiers Pattern
The Three White Soldiers pattern is one of the strongest bullish reversal candlestick patterns, but no candlestick pattern is 100% accurate. Even a perfectly formed pattern can fail if the overall market trend remains bearish or if buying momentum is weak.
Professional traders rarely enter a trade based solely on candlestick patterns. Instead, they combine the Three White Soldiers pattern with technical indicators to improve the probability of success and filter out false signals.
Among the many technical indicators available, Relative Strength Index (RSI), Exponential Moving Average (EMA), and Moving Average Convergence Divergence (MACD) are considered the most effective for confirming this pattern.
Let’s understand how each indicator works and how you can combine it with the Three White Soldiers pattern.
RSI Confirmation Strategy
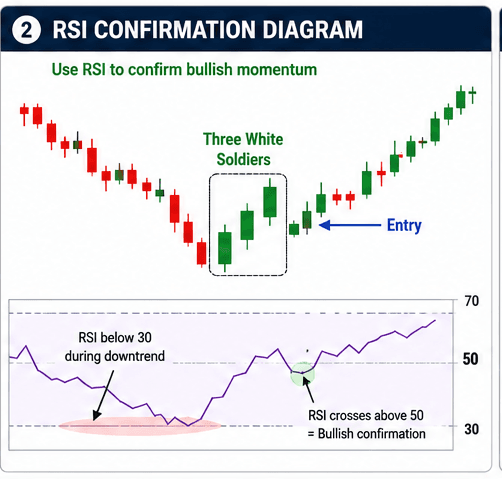
The Relative Strength Index (RSI) is a momentum oscillator that measures the speed and strength of price movements. It helps traders determine whether a stock is overbought, oversold, or gaining bullish momentum.
RSI moves between 0 and 100.
Generally:
- Above 70 = Overbought
- Below 30 = Oversold
- Above 50 = Bullish Momentum
- Below 50 = Bearish Momentum
For the Three White Soldiers pattern, RSI is most useful in identifying whether buyers are genuinely taking control after a downtrend.
Why RSI Works with Three White Soldiers
The Three White Soldiers pattern indicates increasing buying pressure.
RSI measures whether that buying pressure is actually strong enough to support a trend reversal.
When both the candlestick pattern and RSI indicate bullish momentum, the probability of success increases significantly.
Best RSI Settings
Professional traders generally use:
- RSI Period: 14
- Oversold Level: 30
- Overbought Level: 70
These default settings work well for stocks, indices, forex, and cryptocurrencies.
RSI Entry Rules
Enter the trade only when:
✔ Three White Soldiers pattern is complete.
✔ RSI crosses above 50.
✔ RSI is rising steadily.
✔ Price breaks above the third candle.
Stop-Loss
Place the stop-loss:
- Below the first candle.
- Or below the recent swing low.
Target
Book profits:
- At the next resistance level.
- Or maintain a minimum 1:2 Risk-Reward Ratio.
- Trail the stop-loss if momentum remains strong.
Advantages of Using RSI
- Easy to understand.
- Filters weak reversal signals.
- Works on all timeframes.
- Confirms momentum.
- Helps avoid false entries.
Limitations
- RSI can remain overbought during strong trends.
- Should never be used alone.
- Less effective during highly volatile markets.
EMA Confirmation Strategy
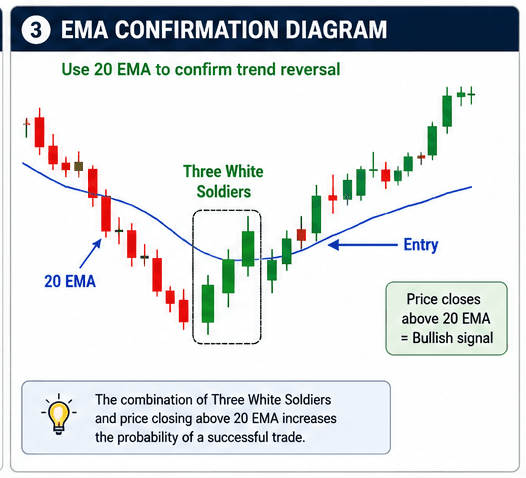
The Exponential Moving Average (EMA) is one of the most popular trend-following indicators.
Unlike the Simple Moving Average (SMA), EMA gives greater importance to recent prices, allowing it to react more quickly to market changes.
Professional traders commonly use:
- 20 EMA
- 50 EMA
- 200 EMA
Why EMA Works with Three White Soldiers
The Three White Soldiers pattern indicates a potential reversal.
EMA confirms whether the overall trend has actually changed.
If price moves above important EMAs after the pattern forms, buyers are more likely to remain in control.
Best EMA Settings
For swing trading:
- 20 EMA
- 50 EMA
For positional trading:
- 50 EMA
- 200 EMA
Entry Rules
Buy only if:
✔ Three White Soldiers pattern forms.
✔ Price closes above the 20 EMA.
✔ 20 EMA is sloping upward.
✔ Volume supports the breakout.
Stop-Loss
Place stop-loss:
- Below the first bullish candle.
- Or slightly below the 20 EMA.
Profit Target
Exit near:
- Major resistance.
- Previous swing high.
- Or trail the stop-loss below the 20 EMA.
Advantages of EMA
- Identifies the trend clearly.
- Dynamic support during uptrends.
- Reduces false reversal trades.
- Excellent for swing trading.
- Easy to combine with candlestick patterns.
Limitations
- Produces delayed signals.
- Can generate whipsaws in sideways markets.
- Less useful without volume confirmation.
MACD Confirmation Strategy
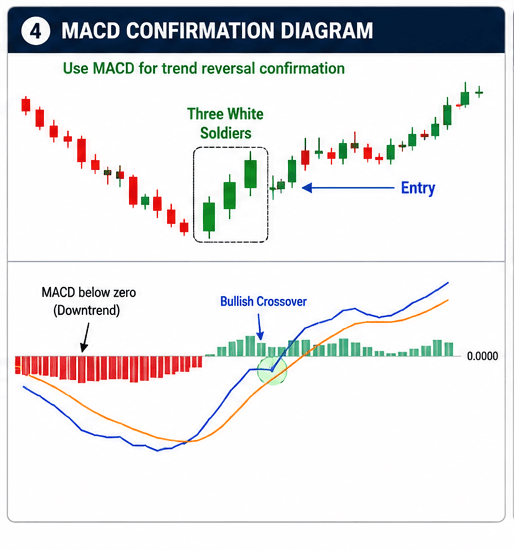
The Moving Average Convergence Divergence (MACD) is a momentum and trend-following indicator.
It consists of:
- MACD Line
- Signal Line
- Histogram
MACD helps traders identify changes in trend strength and momentum.
Why MACD Works with Three White Soldiers
A bullish candlestick pattern indicates buying pressure.
A bullish MACD crossover confirms that momentum has also shifted in favor of buyers.
When both signals occur together, the probability of a successful reversal increases.
Best MACD Settings
The standard settings are:
- 12
- 26
- 9
These settings work well for most markets.
Entry Rules
Enter when:
✔ Three White Soldiers pattern forms.
✔ MACD line crosses above the Signal line.
✔ Histogram turns positive.
✔ Price closes above the third candle.
Stop-Loss
Place stop-loss below:
- First bullish candle.
- Recent swing low.
Profit Target
Exit:
- Near resistance.
- At 1:2 or 1:3 Risk-Reward.
- Or when MACD gives a bearish crossover.
Which Indicator Is the Best?
Each indicator serves a different purpose.
| Indicator | Best Use | Reliability |
|---|---|---|
| RSI | Confirms Momentum | ⭐⭐⭐⭐⭐ |
| EMA | Confirms Trend | ⭐⭐⭐⭐⭐ |
| MACD | Confirms Momentum + Trend | ⭐⭐⭐⭐☆ |
There is no single “best” indicator. The strongest trading decisions come from combining multiple forms of confirmation rather than relying on just one tool.
Combining Multiple Indicators
Professional traders often use a checklist before entering a trade.
A high-probability setup might include:
- Three White Soldiers pattern after a clear downtrend.
- RSI above 50 and rising.
- Price trading above the 20 EMA.
- MACD bullish crossover.
- Increasing trading volume.
- Breakout above the third candle.
- No major resistance immediately overhead.
When several bullish signals align, the trade has a greater probability of success than relying on the candlestick pattern alone.
Professional Indicator Checklist
Before entering a trade, confirm the following:
✅ Three White Soldiers pattern is complete.
✅ RSI is above 50 or rising from oversold levels.
✅ Price is above the 20 EMA.
✅ MACD has generated a bullish crossover.
✅ Volume is higher than average.
✅ Price has broken above the third candle.
✅ Risk-to-reward ratio is at least 1:2.
If most of these conditions are satisfied, the setup is generally stronger than using the candlestick pattern by itself.
Three White Soldiers + RSI Trading Strategy
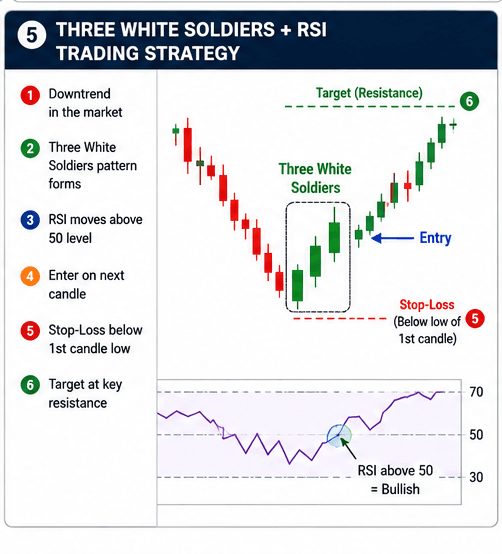
The Three White Soldiers pattern becomes significantly more reliable when combined with the Relative Strength Index (RSI). While the candlestick pattern indicates that buyers are gaining control, RSI confirms whether the buying momentum is strong enough to sustain an uptrend.
This combination helps traders avoid false reversal signals and improves the probability of entering high-quality trades.
Professional swing traders often use this strategy because it combines price action with momentum analysis.
Why Combine RSI with the Three White Soldiers Pattern?
The Three White Soldiers pattern tells you what is happening on the price chart.
RSI tells you how strong that movement is.
When both the candlestick pattern and RSI point in the same direction, the trade has a higher probability of success.
This combination helps traders:
- Filter weak reversal patterns.
- Confirm bullish momentum.
- Reduce false breakouts.
- Improve trade accuracy.
- Increase confidence before entering a position.
Entry Rules
Follow these conditions before entering a trade.
✔ Three White Soldiers pattern forms after a clear downtrend.
✔ RSI moves above the 50 level or bounces strongly from below 30.
✔ The third candle closes near its high.
✔ Trading volume increases during the formation.
✔ The next candle breaks above the high of the third candle.
Enter the trade only after all conditions are satisfied.
Stop-Loss
Place the stop-loss:
- Below the low of the first bullish candle.
- Or below the recent swing low.
Never place the stop-loss too close to the entry price because normal market fluctuations may trigger it unnecessarily.
Profit Target
Professional traders generally use one of the following methods:
- Next major resistance level.
- Previous swing high.
- Minimum 1:2 Risk-Reward Ratio.
- Trail the stop-loss if the trend remains strong.
Example
Imagine a stock has been declining for several weeks and reaches a strong support level.
A Three White Soldiers pattern forms.
During the same period:
- RSI rises from 28 to 54.
- Volume increases.
- The price breaks above the third candle.
This provides strong confirmation that buyers have taken control, making it a high-probability trade.
Three White Soldiers + EMA Trading Strategy
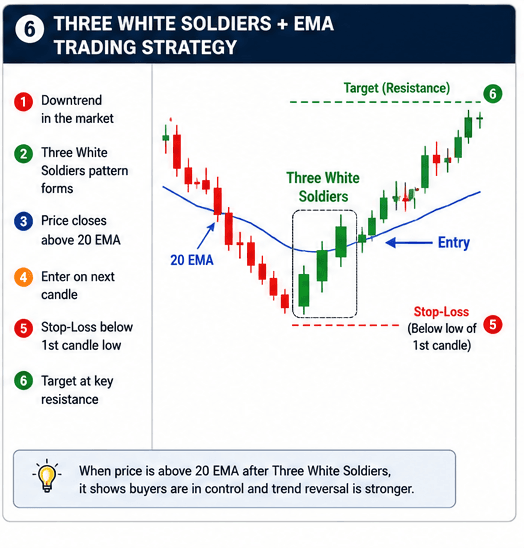
The Exponential Moving Average (EMA) is one of the best trend-following indicators available.
While the Three White Soldiers pattern identifies a possible trend reversal, EMA confirms whether the overall trend has actually changed.
Many professional traders use the 20 EMA and 50 EMA because they react quickly to price movements and act as dynamic support levels.
Why Combine EMA with the Three White Soldiers Pattern?
Candlestick patterns identify market sentiment.
EMA identifies trend direction.
When price moves above an important EMA after forming the Three White Soldiers pattern, it confirms that buyers are beginning to control the trend.
Best EMA Settings
For Swing Trading
- 20 EMA
- 50 EMA
For Positional Trading
- 50 EMA
- 200 EMA
Entry Rules
Enter the trade when:
✔ Three White Soldiers pattern forms.
✔ Price closes above the 20 EMA.
✔ 20 EMA begins sloping upward.
✔ Volume supports the breakout.
✔ Price breaks above the third candle.
Stop-Loss
Place stop-loss:
- Below the first candle.
- Below the recent swing low.
- Slightly below the 20 EMA if it acts as dynamic support.
Profit Target
Exit the trade:
- Near the next resistance level.
- At a 1:2 or 1:3 Risk-Reward Ratio.
- When price closes below the 20 EMA.
Example
Suppose a stock has been in a downtrend for one month.
It forms the Three White Soldiers pattern near a major support zone.
At the same time:
- Price closes above the 20 EMA.
- The 20 EMA starts turning upward.
- Volume increases.
- The breakout above the third candle is confirmed.
This alignment of price action and trend confirmation provides a high-quality buying opportunity.
Risk-Reward Ratio

Every successful trading strategy depends on effective risk management.
The Risk-Reward Ratio compares the amount of money you are willing to risk against the expected profit.
The formula is:
Risk-Reward Ratio = Potential Profit ÷ Potential Loss
1:1 Risk-Reward Ratio
If you risk $100, your target is $100.
Although this ratio offers a high win rate, it limits long-term profitability.
Professional traders generally avoid using a 1:1 ratio unless market conditions are exceptionally favorable.
1:2 Risk-Reward Ratio (Recommended)
If you risk $100, your target becomes $200.
This is the minimum ratio used by many professional traders.
Even if only half of your trades are successful, you can remain profitable over time.
1:3 Risk-Reward Ratio
If you risk $100, your target becomes $300.
This ratio is commonly used in strong trending markets where the probability of sustained price movement is higher.
Example
Suppose you buy a stock at $100.
- Stop-Loss: $96
- Risk: $4
Using a 1:2 Risk-Reward Ratio:
Target = $108
Using a 1:3 Risk-Reward Ratio:
Target = $112
This disciplined approach ensures that profitable trades outweigh losing trades over the long term.
Advantages of the Three White Soldiers Pattern
The Three White Soldiers pattern offers several benefits that make it one of the most respected bullish reversal patterns in technical analysis.
Strong Bullish Reversal Signal
The pattern reflects sustained buying pressure over three consecutive trading sessions, increasing the likelihood of a trend reversal.
Easy to Identify
Its clear structure makes it suitable for both beginners and experienced traders.
Works Across Multiple Markets
The pattern can be applied to:
- Stocks
- Forex
- Commodities
- Cryptocurrencies
- Indices
Suitable for Multiple Timeframes
It performs well on:
- 15-Minute Charts
- Hourly Charts
- Daily Charts
- Weekly Charts
Higher timeframes generally provide more reliable signals.
Combines Well with Technical Indicators
The pattern becomes more reliable when confirmed by:
- RSI
- EMA
- MACD
- Volume Analysis
- Support and Resistance
Limitations of the Three White Soldiers Pattern
Like every technical analysis tool, the Three White Soldiers pattern has limitations.
Understanding these weaknesses helps traders avoid costly mistakes.
False Signals
Not every pattern results in a successful reversal.
Always wait for confirmation before entering a trade.
Weak Performance in Strong Bear Markets
The pattern may fail if the broader market remains strongly bearish.
Trading against the primary trend increases risk.
Resistance Can Limit Upside
If the pattern forms directly below a major resistance zone, buying pressure may weaken before a breakout occurs.
Volume Matters
Patterns formed on low trading volume are generally less reliable than those supported by increasing volume.
Risk Management Remains Essential
Even high-probability setups can fail.
Always use an appropriate stop-loss and position size.
Professional Trading Tips
Experienced traders follow a disciplined process rather than relying on a single signal.
Before entering a trade:
- Wait for the third candle to close.
- Confirm the breakout above the third candle.
- Check that RSI is rising or above 50.
- Ensure price is trading above the 20 EMA.
- Look for increasing trading volume.
- Verify there is enough room before the next resistance.
- Maintain at least a 1:2 Risk-Reward Ratio.
- Never risk more than a small percentage of your trading capital on a single trade.
Following these rules consistently can improve decision-making and help build long-term trading discipline.
Frequently Asked Questions (FAQs)
1. What is the Three White Soldiers candlestick pattern?
The Three White Soldiers is a bullish reversal candlestick pattern that consists of three consecutive bullish candles appearing after a downtrend. It indicates that buyers have taken control of the market and that the bearish trend may reverse into a new uptrend.
2. Is the Three White Soldiers pattern bullish or bearish?
The Three White Soldiers is a bullish reversal pattern. It signals that selling pressure is weakening and buying momentum is increasing, making it a potential indication of an upcoming upward trend.
3. How reliable is the Three White Soldiers pattern?
The pattern is considered one of the most reliable bullish reversal patterns in technical analysis when it appears after a clear downtrend and is confirmed by increasing volume, support levels, and technical indicators such as RSI, EMA, or MACD. However, no candlestick pattern guarantees success, so confirmation and risk management remain essential.
4. Which timeframe is best for trading the Three White Soldiers pattern?
The pattern works on all chart timeframes, but higher timeframes generally produce more reliable signals.
Recommended timeframes include:
- 15-Minute Chart – Intraday Trading
- 1-Hour Chart – Short-Term Trading
- 4-Hour Chart – Swing Trading
- Daily Chart – Swing and Positional Trading
- Weekly Chart – Long-Term Investing
The Daily and Weekly charts are generally preferred because they contain less market noise.
5. Does the Three White Soldiers pattern work in intraday trading?
Yes. The pattern can be used for intraday trading, but lower timeframes tend to generate more false signals. Traders should combine the pattern with volume analysis, RSI, EMA, and support and resistance levels before entering a trade.
6. Can beginners trade the Three White Soldiers pattern?
Yes. The pattern is relatively easy to identify, making it suitable for beginners. However, beginners should avoid trading based solely on the candlestick pattern and should always use confirmation indicators, proper stop-loss placement, and disciplined risk management.
7. Where should I place the stop-loss?
The most common stop-loss placements are:
- Below the low of the first bullish candle.
- Below the lowest point of the entire pattern.
- Below the recent swing low.
Choosing the appropriate stop-loss depends on the market structure and your trading strategy.
8. How do I set a profit target?
Profit targets can be determined using several methods:
- The next major resistance level.
- A fixed Risk-Reward Ratio, such as 1:2 or 1:3.
- A trailing stop-loss.
- Dynamic support provided by the 20 EMA.
Many professional traders also book partial profits at key resistance levels and let the remaining position run.
9. Which indicator works best with the Three White Soldiers pattern?
Several indicators complement the pattern effectively:
- RSI for confirming momentum.
- EMA for confirming trend direction.
- MACD for confirming momentum shifts.
- Volume analysis for validating buying interest.
Rather than relying on a single indicator, combining multiple confirmations generally improves trading accuracy.
10. Should I trade the pattern without confirmation?
No. Although the Three White Soldiers pattern is a strong bullish reversal signal, entering a trade without confirmation increases the likelihood of false breakouts. Waiting for confirmation from indicators, volume, or price action can improve the quality of your trades.
11. Why is volume important when trading this pattern?
Volume shows the level of participation behind a price move.
Increasing volume during the formation of the Three White Soldiers pattern indicates that buyers are genuinely supporting the rally. Low volume may suggest weak buying interest and increase the possibility of a failed reversal.
12. What are the most common mistakes traders make?
Some of the most common mistakes include:
- Trading the pattern without a prior downtrend.
- Ignoring nearby resistance levels.
- Entering before the third candle closes.
- Ignoring volume confirmation.
- Trading against the overall market trend.
- Failing to use a stop-loss.
- Chasing the price after a large breakout.
Avoiding these mistakes can improve consistency over time.
13. Does the pattern work in all financial markets?
Yes. The Three White Soldiers pattern can be applied to various markets, including:
- Stocks
- Forex
- Commodities
- Cryptocurrencies
- Stock Indices
Since candlestick analysis is based on price action, the pattern works across most liquid financial markets.
14. Can the Three White Soldiers pattern fail?
Yes. No technical pattern is perfect.
The pattern may fail due to:
- Strong overhead resistance.
- Weak trading volume.
- Bearish news events.
- High market volatility.
- Trading against the higher-timeframe trend.
- False breakouts.
Using confirmation indicators and proper risk management helps reduce the impact of failed trades.
15. How do professional traders confirm the Three White Soldiers pattern?
Professional traders rarely rely on a single signal. They typically confirm the pattern using several factors, including:
- A clear preceding downtrend.
- Strong bullish candle bodies.
- Increasing trading volume.
- RSI moving above 50.
- Price trading above the 20 EMA.
- MACD bullish crossover.
- Breakout above the third candle.
- Adequate distance from major resistance.
- A favorable Risk-Reward Ratio of at least 1:2.
This multi-factor approach helps identify higher-probability trading opportunities.
Conclusion
The Three White Soldiers candlestick pattern is one of the most reliable bullish reversal patterns available to traders. It reflects a gradual shift in market sentiment, where buyers steadily overcome sellers and establish control over price action. While the pattern is powerful on its own, its effectiveness improves significantly when combined with technical confirmations such as RSI, EMA, MACD, trading volume, and key support and resistance levels.
Successful trading is not about identifying patterns alone—it is about understanding the story behind them. The psychology driving the Three White Soldiers pattern highlights the transition from fear to confidence, making it an important signal for traders looking to capture the early stages of a new uptrend.
However, no pattern guarantees profits. Market conditions, economic events, and trader behavior can all influence the outcome of a trade. This is why disciplined risk management, proper stop-loss placement, and a favorable risk-reward ratio are essential components of every trading plan.
By combining technical analysis with patience, confirmation, and consistent execution, traders can use the Three White Soldiers pattern as part of a structured trading strategy rather than relying on it as a standalone signal. Over time, this disciplined approach can improve decision-making and contribute to more consistent trading performance.
Whether you are a beginner learning candlestick analysis or an experienced trader refining your strategy, mastering the Three White Soldiers pattern can add a valuable tool to your technical analysis toolkit.
Key Takeaways
- The Three White Soldiers is a strong bullish reversal candlestick pattern.
- It forms after a clear downtrend and consists of three consecutive bullish candles.
- Wait for confirmation before entering a trade.
- Use RSI, EMA, MACD, and volume to improve trade quality.
- Place the stop-loss below the pattern or recent swing low.
- Aim for a minimum Risk-Reward Ratio of 1:2.
- Avoid trading directly below strong resistance.
- Combine the pattern with overall market trend analysis for higher-probability setups.
- Practice the strategy on historical charts before using it with real capital.
- Consistent risk management is more important than any single candlestick pattern.