Introduction
Financial markets are driven by a continuous battle between buyers and sellers. Every candlestick on a price chart reflects this struggle, revealing who currently has control and whether market sentiment is strengthening or weakening. While hundreds of technical indicators attempt to predict future price movements, many experienced traders rely on candlestick patterns because they provide a direct view of market psychology.
Among all bearish reversal patterns, the Bearish Engulfing Pattern is considered one of the most reliable and widely used. It is simple to identify, appears across all financial markets, and often signals the beginning of a meaningful downward move after an established uptrend.
However, many beginner traders make the mistake of selling immediately after spotting the pattern. In reality, a Bearish Engulfing Pattern is not a guarantee that prices will fall. Like every technical analysis tool, it should be viewed as a probability-based signal rather than a prediction. The highest-quality setups occur when the pattern forms near major resistance levels, after a strong bullish trend, and is supported by additional confirmation such as increasing selling volume or bearish momentum indicators.
Understanding why the pattern forms is just as important as recognizing what it looks like. The two candles represent a dramatic shift in market sentiment—from buyer dominance to aggressive selling pressure. This transition often attracts institutional traders and signals that the existing uptrend may be losing strength.
In this comprehensive guide, you’ll learn how the Bearish Engulfing Pattern forms, the psychology behind each candle, how to identify genuine setups, effective trading strategies, confirmation techniques using indicators like RSI and MACD, risk management principles, common mistakes to avoid, and practical examples that can help improve your trading decisions.
Whether you’re trading stocks, forex, cryptocurrencies, commodities, or indices, mastering the Bearish Engulfing Pattern can help you identify potential market tops with greater confidence and discipline.
What Is the Bearish Engulfing Pattern?
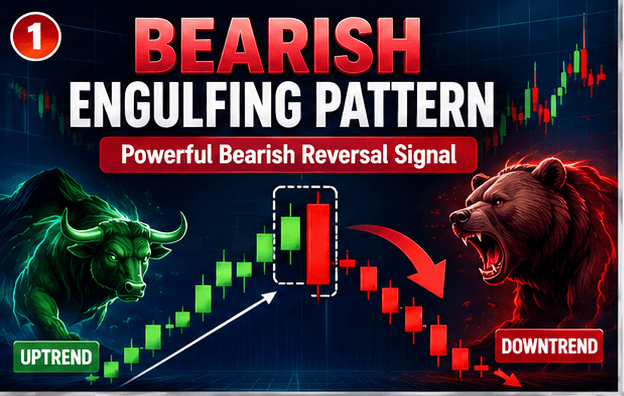
The Bearish Engulfing Pattern is a two-candle bearish reversal pattern that typically appears after an established uptrend. It signals that buyers may be losing control while sellers are becoming increasingly aggressive, creating the possibility of a downward reversal.
The pattern consists of:
- A small bullish candle followed by
- A larger bearish candle whose body completely engulfs the real body of the previous bullish candle.
The second candle demonstrates that selling pressure has become strong enough to erase all of the previous session’s bullish progress. This sudden shift in momentum is what makes the pattern important to technical traders.
Unlike continuation patterns that indicate the existing trend may continue, the Bearish Engulfing Pattern is specifically designed to identify potential trend reversals.
Although the pattern appears frequently on charts, its reliability depends heavily on market context. It performs best after a sustained uptrend, near significant resistance levels, and when supported by increased trading volume.
Structure of the Bearish Engulfing Pattern
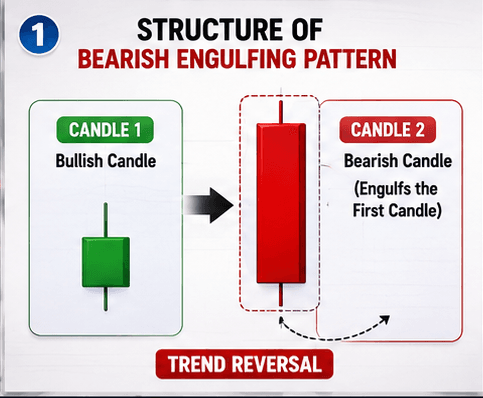
The Bearish Engulfing Pattern consists of two consecutive candles, each representing a different stage in the battle between buyers and sellers.
Understanding the role of each candle helps traders interpret the pattern more effectively instead of simply memorizing its shape.
First Candle – Bullish Candle
The first candle is a relatively small bullish candle.
This candle shows that buyers are still confident and continue pushing prices higher. Since the market has already been in an uptrend, many traders expect the bullish momentum to continue.
Characteristics:
- Small green candle
- Appears after a clear uptrend
- Buyers remain in control
- Continues bullish sentiment
Although buyers still dominate during this session, the relatively small size of the candle sometimes suggests that momentum is beginning to slow.
Second Candle – Large Bearish Candle
The second candle is the defining feature of the pattern.
It opens at or above the previous candle’s close before strong selling pressure pushes the price sharply lower. By the end of the session, the bearish candle completely engulfs the real body of the first bullish candle.
Characteristics:
- Large red candle
- Completely engulfs the previous bullish body
- Strong selling pressure
- Sellers gain market control
This dramatic reversal demonstrates that sellers have overwhelmed buyers within a single trading session.
The Psychology Behind the Bearish Engulfing Pattern
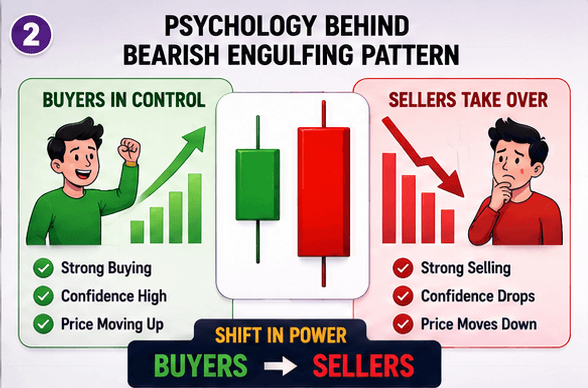
Professional traders focus on understanding the emotions behind price movement rather than simply memorizing chart patterns.
The Bearish Engulfing Pattern tells a clear psychological story.
Stage 1 – Buyers Remain Optimistic
The market has been moving upward for several sessions or weeks.
Confidence is high.
Many retail traders believe the uptrend will continue indefinitely, encouraging additional buying.
The first bullish candle reinforces this optimism.
At this stage, buyers appear firmly in control.
Stage 2 – Sellers Enter Aggressively
The next trading session begins with buyers attempting to continue the rally.
However, institutional sellers and profit-taking investors begin entering the market.
Selling pressure increases rapidly.
As more participants sell, buyers struggle to maintain higher prices.
Eventually, sellers overwhelm demand and drive prices sharply lower.
By the close of the session, the entire body of the previous bullish candle has been engulfed.
This sudden reversal often surprises traders who entered late during the uptrend.
Stage 3 – Market Sentiment Changes
The second candle changes market psychology.
Instead of confidence, uncertainty begins spreading through the market.
Some buyers exit profitable positions.
Short sellers begin identifying opportunities.
Institutional traders recognize weakening momentum.
This shift from optimism to caution is why the Bearish Engulfing Pattern is considered one of the strongest bearish reversal signals.
Why Does the Bearish Engulfing Pattern Work?
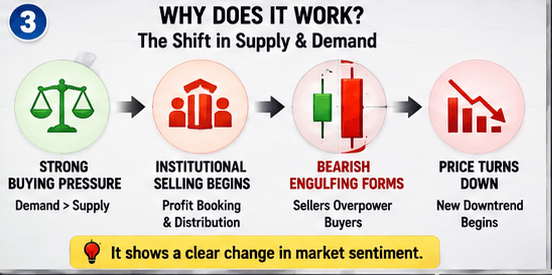
The Bearish Engulfing Pattern reflects a genuine change in the balance between supply and demand.
During an uptrend, buying pressure consistently exceeds selling pressure.
Eventually, however, prices reach levels where:
- Institutional investors begin booking profits.
- Value-oriented traders stop buying.
- Short sellers become active.
- Retail traders continue buying near market highs.
When selling demand suddenly exceeds buying demand, a large bearish candle forms.
The engulfing candle demonstrates that sellers have not only absorbed buying pressure but have also reversed the market within a single session.
This shift often marks the beginning of a correction or a larger bearish trend.
However, traders should remember that no candlestick pattern guarantees future price movement.
The Bearish Engulfing Pattern provides a high-probability warning, not certainty.
Its effectiveness improves significantly when combined with:
- Major resistance levels
- High trading volume
- RSI moving out of overbought territory
- MACD bearish crossover
- Trendline resistance
- Bearish divergence
- Higher timeframe confirmation
Professional traders rarely rely on one signal alone. Instead, they combine multiple forms of technical evidence before taking a trade.
Where Does the Bearish Engulfing Pattern Perform Best?
The Bearish Engulfing Pattern can appear in almost any financial market, but it delivers the strongest signals when it forms under favorable conditions.
The pattern is generally more reliable when it appears:
- After a prolonged uptrend
- Near major resistance levels
- Around previous swing highs
- At Fibonacci retracement or extension levels
- After an overextended bullish rally
- On higher timeframes such as the 4-hour, daily, and weekly charts
It is widely used across different asset classes, including:
- Stocks
- Forex
- Cryptocurrencies
- Commodities
- Stock indices
- Exchange-Traded Funds (ETFs)
Although the pattern may also appear on lower timeframes, higher-timeframe setups generally produce stronger and more dependable reversal signals because they contain less market noise.
The key takeaway is simple: the location of the pattern matters just as much as the pattern itself. A Bearish Engulfing Pattern appearing at a major resistance level carries far more significance than one forming randomly within a sideways market.
How to Identify a Genuine Pattern
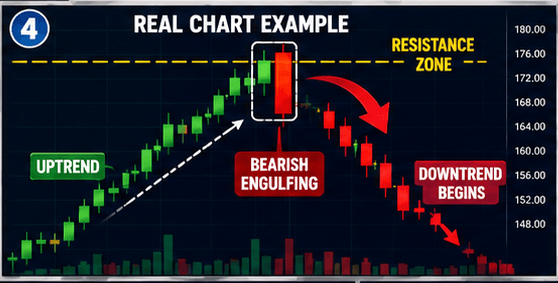
TradingView –https://www.tradingview.com/
Not every large bearish candle qualifies as a Bearish Engulfing Pattern. Many traders make the mistake of entering a sell trade simply because they notice a red candle larger than the previous green one. In reality, the pattern becomes meaningful only when it appears under the right market conditions.
A genuine Bearish Engulfing Pattern tells a story of changing momentum. It reflects a situation where buyers initially appear confident, but sellers suddenly step in with enough strength to reverse that optimism within a single trading session.
Before considering a trade, use the following checklist to evaluate the quality of the setup.
1. A Clear Uptrend Should Already Exist
The Bearish Engulfing Pattern is designed to signal a potential trend reversal, not the continuation of an existing downtrend.
If the market has already been falling or moving sideways for several days, the pattern loses much of its significance.
Look for an established uptrend characterized by:
- Higher highs
- Higher lows
- Consistent bullish momentum
- Strong buying interest
The stronger the preceding uptrend, the more meaningful the reversal signal becomes.
2. The First Candle Should Be Bullish
The first candle represents the final stage of buyer confidence.
Ideally, it should be a small or medium-sized bullish candle that continues the existing upward trend.
Although buyers remain in control during this session, the relatively smaller candle body may indicate that momentum is slowing.
3. The Second Candle Must Completely Engulf the First
This is the defining characteristic of the pattern.
The body of the bearish candle should completely cover the real body of the previous bullish candle.
The candle should demonstrate decisive selling pressure rather than a minor pullback.
The larger the bearish candle, the stronger the message it sends to the market.
4. The Pattern Should Form Near Resistance
Location is one of the most overlooked aspects of candlestick analysis.
A Bearish Engulfing Pattern that forms near a well-established resistance level is generally more reliable than one appearing randomly in the middle of an uptrend.
Strong locations include:
- Previous swing highs
- Horizontal resistance zones
- Trendline resistance
- Fibonacci retracement levels
- Psychological price levels
When multiple technical factors align, the probability of a successful reversal often improves.
5. Selling Volume Should Increase
Volume measures participation.
If the bearish engulfing candle forms with noticeably higher trading volume, it suggests that larger market participants are actively selling.
This adds credibility to the reversal signal.
Low-volume reversals, on the other hand, should be treated with caution because they may simply represent temporary profit booking.
Step-by-Step Bearish Engulfing Trading Strategy
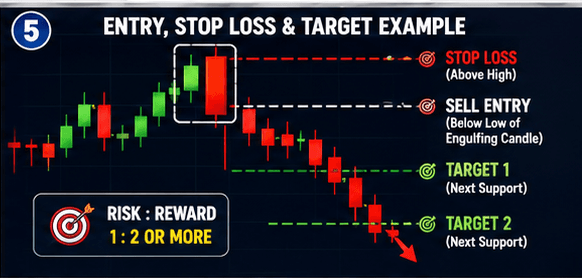
Recognizing the pattern is only the first step.
The next challenge is executing the trade with proper timing and disciplined risk management.
A structured approach removes emotional decision-making and improves long-term consistency.
Entry Rule
The safest approach is to wait until the bearish engulfing candle has fully closed.
Conservative traders often wait for additional confirmation by entering only after price breaks below the low of the bearish candle.
This reduces the risk of entering a false reversal.
Stop-Loss Placement
Protecting capital is more important than maximizing profits.
Common stop-loss locations include:
- Above the high of the engulfing candle
- Above the nearest resistance level
- Above the recent swing high
Avoid placing the stop-loss too close to the entry price, as normal market fluctuations may trigger an unnecessary exit.
Profit Target
Professional traders generally use one or more of the following target methods:
Previous Support Zone
Exit near the next major support level, where buyers may return.
Risk-to-Reward Ratio
Aim for a minimum 1:2 Risk-to-Reward Ratio.
For example:
- Risk: 100
- Target: 200
Maintaining favorable risk-to-reward ratios allows traders to remain profitable even if some trades fail.
Trailing Stop
If the market continues trending downward, trailing the stop-loss above lower highs can help maximize profits while protecting gains.
Bearish Engulfing with RSI Confirmation
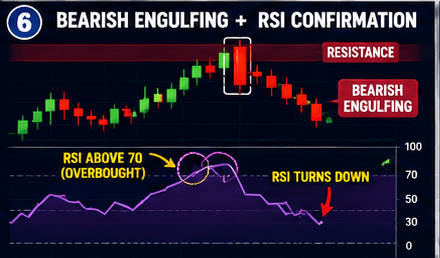
The Relative Strength Index (RSI) is one of the most effective indicators for confirming Bearish Engulfing setups.
A high-quality signal often includes:
- RSI above 70 (Overbought)
- Bearish Engulfing Pattern near resistance
- RSI is turning downward after the pattern forms
This combination indicates that buying momentum may be fading and sellers are beginning to dominate.
Remember that RSI should support the candlestick pattern, not replace it.
Bearish Engulfing with MACD
The MACD (Moving Average Convergence Divergence) indicator measures momentum.
A stronger bearish setup occurs when:
- The Bearish Engulfing Pattern appears.
- MACD produces a bearish crossover.
- The MACD histogram begins moving below zero.
This suggests that bullish momentum is weakening and the probability of a reversal is increasing.
Bearish Engulfing with Support and Resistance
Candlestick patterns become much more reliable when they align with key price levels.
For example:
- Price rallies into a long-term resistance zone.
- A Bearish Engulfing Pattern forms.
- Buyers fail to break resistance.
- Sellers take control.
This sequence often creates a high-probability bearish trading opportunity.
Instead of trading every engulfing candle, focus on those appearing at important market levels.
Bearish Engulfing with Volume Analysis
Volume tells you whether the market agrees with the reversal.
An ideal setup looks like this:
- Moderate buying volume during the first bullish candle.
- Significant increase in selling volume during the engulfing candle.
This suggests that institutional participants may be distributing positions rather than simply taking short-term profits.
Volume confirmation often separates stronger setups from weaker ones.
Common Mistakes Traders Make
Many traders know how to identify the Bearish Engulfing Pattern but still struggle to trade it successfully.
Avoid these common mistakes.
Selling Without Confirmation
Entering immediately after spotting the pattern can lead to false signals.
Always wait for the engulfing candle to close and, when possible, seek confirmation from price action or indicators.
Ignoring the Overall Trend
A Bearish Engulfing Pattern during a powerful long-term uptrend may produce only a short-term pullback.
Always analyze higher timeframes before taking a trade.
Ignoring Volume
A reversal supported by high selling volume is generally more reliable than one formed during quiet trading sessions.
Volume helps measure the conviction behind the move.
Placing the Stop-Loss Too Close
Markets naturally fluctuate.
If the stop-loss is placed only a few points above the engulfing candle, normal price movement may trigger an unnecessary exit.
Give the trade sufficient room while maintaining proper position sizing.
Risking Too Much on One Trade
Even textbook-perfect setups can fail.
Professional traders protect their capital by limiting risk on every trade rather than trying to maximize profits from a single opportunity.
Practical Trading Example
Imagine a stock rallies steadily from 700 to 850 over several weeks.
As the price approaches a major resistance level:
- Day 1 forms a small bullish candle.
- Day 2 opens slightly higher but closes with a large bearish candle that completely engulfs the previous candle.
- RSI falls from 74 to 68.
- MACD produces a bearish crossover.
- Selling volume increases significantly.
Trade Plan
- Entry: Sell below the low of the engulfing candle.
- Stop-Loss: Above the high of the engulfing candle.
- Target 1: Previous support level.
- Target 2: Next major demand zone.
Rather than relying on the candlestick pattern alone, this trade combines market structure, resistance, momentum indicators, and volume analysis to improve the probability of success.
Key Takeaways
A Bearish Engulfing Pattern is much more than two candles on a chart.
It represents a meaningful shift in market sentiment where sellers suddenly overpower buyers after an established uptrend.
The highest-quality setups generally occur when:
- The market is already trending upward.
- The bearish candle completely engulfs the previous bullish body.
- The pattern forms near a strong resistance level.
- Selling volume increases.
- RSI moves away from overbought conditions.
- MACD confirms weakening bullish momentum.
- Proper risk management is followed.
When these conditions align, the Bearish Engulfing Pattern becomes one of the most dependable bearish reversal signals available to technical traders.
Advanced Bearish Engulfing Trading Strategies
Identifying a Bearish Engulfing Pattern is only the first step. Professional traders rarely make trading decisions based on a single candlestick. Instead, they combine candlestick patterns with chart structures, momentum indicators, and key price levels to improve the probability of successful trades.
Below are some practical ways to use the Bearish Engulfing Pattern in real trading environments.
Bearish Engulfing with Head and Shoulders Pattern
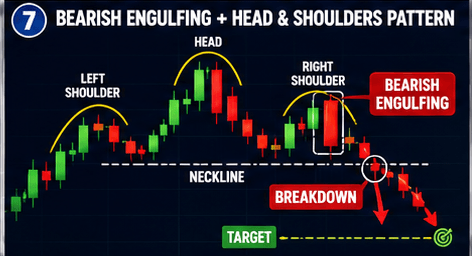
The Head and Shoulders is one of the strongest bearish reversal chart patterns in technical analysis. It represents a gradual loss of buying momentum and often marks the end of a sustained uptrend.
A Bearish Engulfing Pattern forming near the right shoulder provides additional confirmation that buyers are struggling to push prices higher.
Trading Setup
- The market is in an established uptrend.
- The left shoulder and head have already formed.
- Price rallies to create the right shoulder.
- A Bearish Engulfing Pattern appears near the top of the right shoulder.
- Price breaks below the neckline.
Entry
Enter a sell trade after the engulfing candle closes and price breaks below the neckline.
Stop-Loss
Place the stop-loss above the high of the right shoulder.
Target
Measure the distance from the head to the neckline and project that distance below the neckline.
Waiting for both the chart pattern and the candlestick confirmation helps reduce false entries.
Bearish Engulfing with Double Top Pattern
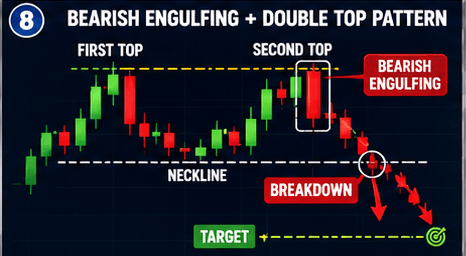
The Double Top is another widely respected bearish reversal pattern. It forms when price tests the same resistance level twice but fails to move higher.
When a Bearish Engulfing Pattern appears at the second top, it often signals that sellers have taken control before the neckline is broken.
Trading Setup
- Strong uptrend.
- First top forms.
- Price pulls back.
- The second top reaches the same resistance.
- Bearish Engulfing Pattern forms.
- Neckline breaks.
Entry
Sell below the low of the engulfing candle or after the neckline breakdown.
Stop-Loss
Above the second top.
Target
Project the height of the Double Top below the neckline.
This combination provides both structural confirmation and immediate bearish momentum.
Bearish Engulfing with Rising Wedge Pattern
A Rising Wedge is a bearish chart pattern where price continues rising, but each new high becomes weaker than the previous one.
If a Bearish Engulfing Pattern appears near the upper trendline of the wedge, it often indicates that the breakout to the upside has failed.
This setup is popular among swing traders because it combines weakening trend structure with a clear reversal signal.
Institutional Perspective
Many retail traders focus only on candle shapes.
Institutional traders look beyond the candles and ask a different question:
“Where is liquidity likely to be?”
During a strong uptrend, retail traders often continue buying as prices make new highs.
Institutions may use this buying pressure to distribute their positions at attractive prices.
The Bearish Engulfing Pattern often reflects this transition.
The first bullish candle attracts late buyers.
The second bearish candle shows institutions absorbing buying demand and driving prices lower.
Understanding this perspective helps traders appreciate that candlestick patterns represent changes in order flow rather than magical signals.
Advantages of the Bearish Engulfing Pattern
The Bearish Engulfing Pattern remains popular because it offers several practical benefits.
Clear and Easy to Identify
The two-candle structure makes it one of the simplest reversal patterns for beginners.
Works Across Multiple Markets
It can be applied to:
- Stocks
- Forex
- Cryptocurrencies
- Commodities
- Indices
- ETFs
Suitable for Multiple Timeframes
The pattern works on intraday, swing trading, and long-term investment charts.
Higher timeframes generally provide stronger signals.
Provides Well-Defined Risk
The high of the engulfing candle often serves as a logical stop-loss location.
Limitations of the Pattern
Despite its popularity, the Bearish Engulfing Pattern is not perfect.
Traders should understand its limitations.
- It can generate false signals during strong bullish trends.
- Low-volume patterns are generally less reliable.
- It should not be traded without confirmation.
- Sideways markets frequently produce misleading engulfing candles.
- Major news events can invalidate technical setups.
Professional traders always combine the pattern with broader market analysis.
Risk Management Rules
The quality of your trading results depends more on risk management than on finding perfect entries.
Follow these principles consistently.
Risk: Only a Small Percentage
Limit each trade to 1–2% of your trading capital.
Always Define Your Stop-Loss
Never enter a trade without knowing where you will exit if the market moves against you.
Maintain Positive Risk-to-Reward
Aim for trades offering at least a 1:2 Risk-to-Reward Ratio.
Never Average Into Losing Trades
Accept small losses quickly instead of increasing exposure.
Protect Profits
Use trailing stop-loss techniques when the market trends in your favor.
Professional Trading Checklist
Before entering a Bearish Engulfing trade, ask yourself:
✔ Is the market in a strong uptrend?
✔ Does the bearish candle completely engulf the previous bullish body?
✔ Is the pattern near an important resistance level?
✔ Has selling volume increased?
✔ Is RSI moving away from overbought conditions?
✔ Has MACD confirmed bearish momentum?
✔ Does the trade offer at least a 1:2 Risk-to-Reward Ratio?
✔ Have you planned your stop-loss and profit target?
If most answers are Yes, the setup is generally stronger.
Frequently Asked Questions (FAQs)
Is the Bearish Engulfing Pattern bullish or bearish?
It is a bearish reversal pattern that suggests buyers are losing control and sellers are becoming dominant.
How many candles make a Bearish Engulfing Pattern?
The pattern consists of two candles:
- A bullish candle
- A larger bearish candle that completely engulfs the body of the first candle
Which timeframe works best?
Although the pattern appears on every timeframe, 4-hour, daily, and weekly charts generally produce more dependable signals because they contain less market noise.
Can beginners trade this pattern?
Yes.
Its simple structure makes it beginner-friendly, but confirmation from support, resistance, RSI, MACD, or volume should always be considered before entering a trade.
Which indicators work best?
The most commonly used confirmation tools include:
- RSI
- MACD
- Volume Analysis
- Support and Resistance
- Moving Averages
- Fibonacci Retracement
Does the Bearish Engulfing Pattern work in crypto?
Yes.
Because it is based on price action, the pattern works in stocks, forex, cryptocurrencies, commodities, indices, and ETFs.
Conclusion
The Bearish Engulfing Pattern is one of the most effective bearish reversal signals because it reflects a decisive shift in market sentiment. A strong bullish trend can continue for weeks, but when sellers suddenly overwhelm buyers and erase the previous session’s gains, it often indicates that momentum is changing.
However, successful trading is not about reacting to a single candlestick. The highest-probability opportunities arise when the Bearish Engulfing Pattern appears near major resistance levels, aligns with chart patterns such as the Head and Shoulders or Double Top, and is supported by confirmation from RSI, MACD, volume, or overall market structure.
No trading pattern is perfect. Every setup carries risk. The key to long-term success lies in combining high-quality analysis with disciplined risk management, patience, and consistency.
Treat the Bearish Engulfing Pattern as one piece of a complete trading plan—not as a standalone signal—and it can become a valuable tool for identifying potential market reversals across stocks, forex, cryptocurrencies, and other financial markets.