Introduction
Imagine you’re watching a runner preparing for a sprint. Before accelerating toward the finish line, the runner briefly slows down, regains balance, and then explodes with full momentum.
Financial markets often behave similarly.
After a strong bullish trend, prices don’t always continue moving upward without interruption. Instead, they frequently pause, allowing buyers and sellers to reach a temporary balance. This pause creates a rounded consolidation, followed by a small pullback before the next upward move begins.
This unique price structure is known as the Cup and Handle Pattern, one of the most reliable bullish continuation patterns in technical analysis.
Professional traders across the stock market, forex, commodities, cryptocurrencies, and indices use this pattern to identify high-probability breakout opportunities.
Unlike many chart patterns that simply indicate a potential reversal, the Cup and Handle Pattern reflects the gradual return of buying strength after a healthy correction.
When combined with volume analysis, support and resistance, Fibonacci retracement, and proper risk management, it can provide excellent trading opportunities with favorable risk-to-reward ratios.
In this comprehensive guide, you’ll learn:
- What the Cup and Handle Pattern is
- Why the pattern works
- How to identify a valid setup
- Market psychology behind the pattern
- Entry strategies
- Stop-loss placement
- Profit targets
- Common mistakes
- Professional trading tips
Whether you’re a beginner or an experienced trader, understanding this pattern can improve your ability to recognize high-quality bullish setups.
What is the Cup and Handle Pattern?
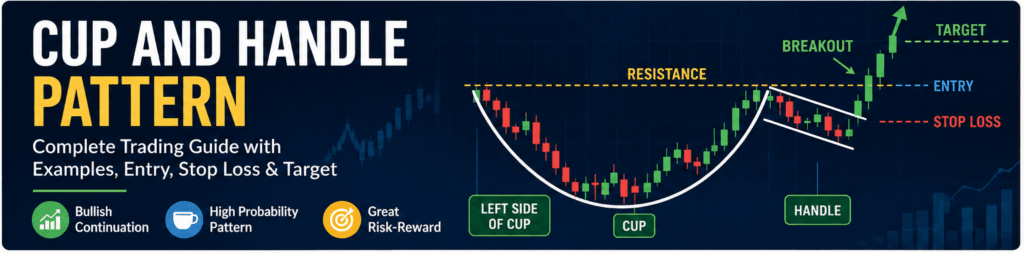
The Cup and Handle Pattern is a bullish continuation chart pattern that usually develops after an existing uptrend.
It represents a temporary pause in the market before buyers regain control and push prices toward new highs.
The pattern consists of two distinct parts:
- A rounded Cup
- A smaller consolidation known as the Handle
Once the price breaks above the resistance created by the handle, traders often interpret it as confirmation that the bullish trend is likely to continue.
Unlike sharp V-shaped reversals, the Cup and Handle Pattern develops gradually. This gradual formation indicates that weak hands have exited the market while stronger buyers continue accumulating positions.
Because of this accumulation process, breakouts from a well-formed Cup and Handle Pattern are generally considered more reliable than many other continuation patterns.
Why is it Called a Cup and Handle Pattern?
The pattern gets its name because its structure resembles a tea cup.
The first part forms a smooth rounded bowl, similar to the shape of a cup.
After the cup is completed, the market experiences a small pullback that resembles the handle.
When viewed on a price chart, the complete structure looks almost identical to a coffee cup with a handle.
This visual similarity makes the pattern one of the easiest chart formations for beginners to recognize.
Structure of the Cup and Handle Pattern
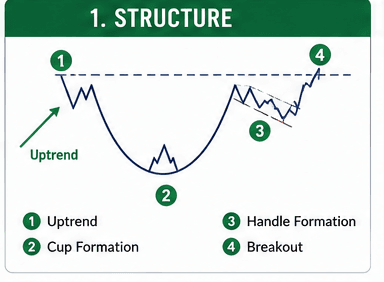
A valid Cup and Handle Pattern consists of four important components.
Understanding each component individually helps traders identify high-quality setups.
1. Prior Uptrend
Before the pattern begins, there should already be a strong bullish trend.
The Cup and Handle Pattern is a continuation pattern, not a reversal pattern.
Without an existing uptrend, the reliability of the pattern decreases significantly.
Professional traders generally avoid trading Cup and Handle formations that appear during sideways markets.
2. Cup Formation
After a strong rally, buyers begin booking profits.
Selling pressure slowly increases, causing prices to decline.
Instead of falling sharply, the market gradually rounds off, forming a smooth U-shaped structure.
Eventually, buyers return.
Demand slowly increases.
The price climbs back toward the previous resistance level.
This rounded recovery forms the cup.
A proper cup should have:
- Smooth U-shape
- Gradual decline
- Gradual recovery
- Similar highs on both sides
Sharp V-shaped recoveries are generally considered less reliable because they indicate excessive volatility rather than controlled accumulation.
3. Handle Formation
After reaching the previous resistance, some traders begin taking profits.
Instead of reversing completely, the market experiences a small pullback.
This pullback forms the handle.
The handle usually develops as:
- Small downward channel
- Small flag
- Tight consolidation
- Slight retracement
The handle represents the final shakeout before buyers regain control.
4. Breakout
The breakout is the most important stage.
A valid breakout occurs when:
- Price closes above the handle resistance.
- Buying volume increases.
- Momentum indicators support the move.
This breakout often signals the continuation of the previous uptrend.
Market Psychology Behind the Cup and Handle Pattern
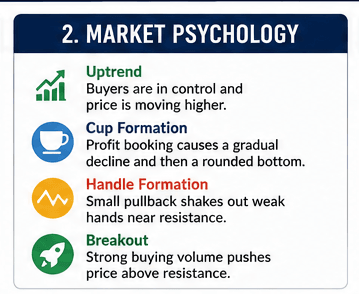
One of the biggest mistakes beginners make is memorizing patterns without understanding the psychology behind them.
Professional traders focus more on market psychology than the shape itself.
Phase 1 – Strong Uptrend
The market is optimistic.
Buyers dominate.
Institutions continue accumulating positions.
Retail traders become increasingly bullish.
Phase 2 – Profit Booking
After a significant rally, early buyers begin booking profits.
Selling pressure increases.
Prices slowly decline.
However, the decline remains controlled because long-term investors continue buying.
Phase 3 – Accumulation
Near the bottom of the cup, buyers and sellers reach equilibrium.
Large institutional traders quietly accumulate shares.
Volume generally decreases during this phase.
The market appears boring.
Many impatient traders exit.
This transfer of shares from weak hands to strong hands is one of the reasons the pattern often produces powerful breakouts.
Phase 4 – Recovery
Buying pressure gradually returns.
Demand starts exceeding supply.
Prices slowly climb back toward resistance.
Confidence begins returning to the market.
Phase 5 – Handle Formation
As the price approaches the previous high, traders who bought near that level finally recover their losses.
Many of them sell to exit at break-even.
This creates temporary selling pressure.
Instead of collapsing, the market forms only a small pullback.
This shows that sellers are losing strength.
Phase 6 – Breakout
Eventually, buyers absorb the remaining supply.
Resistance breaks.
Volume increases sharply.
Momentum traders enter new positions.
Institutional buying accelerates.
The market begins a fresh bullish trend.
Characteristics of a Valid Cup and Handle Pattern
Not every rounded formation is a genuine Cup and Handle Pattern.
A high-quality setup generally includes the following characteristics:
- A clear prior uptrend
- Smooth U-shaped cup
- Shallow handle
- Handle retraces less than one-third of the cup
- Strong breakout above resistance
- Increased volume during breakout
- Breakout closes above resistance
- No major resistance immediately above the breakout
The cleaner the structure, the more reliable the pattern tends to be.
How to Identify a Valid Cup and Handle Pattern
Many traders make the mistake of trading every rounded price structure they see. However, not every rounded chart is a genuine Cup and Handle Pattern. A high-quality setup follows a specific structure and shows clear signs of bullish continuation.
Before placing a trade, confirm the following conditions:
- A strong uptrend exists before the pattern begins.
- The cup has a smooth U-shaped formation rather than a sharp V-shaped reversal.
- Both sides of the cup reach approximately the same resistance level.
- The handle forms near the top of the cup.
- The handle remains relatively shallow and does not retrace deeply.
- Trading volume decreases during the handle.
- Volume expands significantly during the breakout.
The more of these conditions that are present, the higher the probability of a successful trade.
How to Spot False Cup and Handle Patterns
Not every breakout leads to a profitable trade. Learning to recognize weak setups can help you avoid unnecessary losses.
Watch for these warning signs:
No Prior Uptrend
The Cup and Handle Pattern is a continuation pattern. If it appears after a prolonged downtrend or in a sideways market, its reliability decreases significantly.
V-Shaped Cup
A sharp V-shaped recovery often indicates excessive volatility instead of healthy accumulation.
Professional traders generally prefer smooth U-shaped cups.
Deep Handle
The handle should represent only a minor pullback.
If the handle retraces more than 50% of the cup, the pattern becomes weaker.
Weak Breakout Volume
A breakout without increased buying volume often lacks conviction.
Such breakouts are more likely to fail.
Immediate Rejection
If price breaks above resistance but quickly falls back below the breakout level, it usually indicates a false breakout.
Waiting for the candle to close above resistance reduces this risk.
How to Trade the Cup and Handle Pattern
Trading the Cup and Handle Pattern becomes much easier when you follow a structured process instead of relying on emotions.
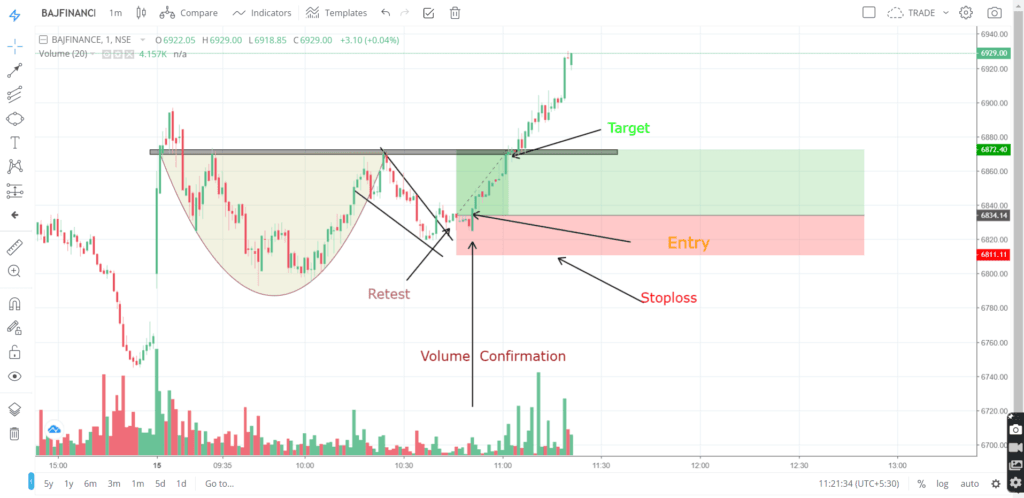
Step 1: Wait for the Cup to Complete
Never assume the cup is complete before the price returns near the previous resistance.
Patience is one of the biggest advantages professional traders have.
Step 2: Wait for the Handle
After the cup reaches resistance, avoid entering immediately.
Allow the market to form a healthy handle.
The handle confirms that sellers are gradually losing control.
Step 3: Wait for Breakout Confirmation
The trade becomes valid only after the price closes above the handle resistance.
Many traders enter too early and get trapped in false breakouts.
Always wait for confirmation.
Entry Strategies
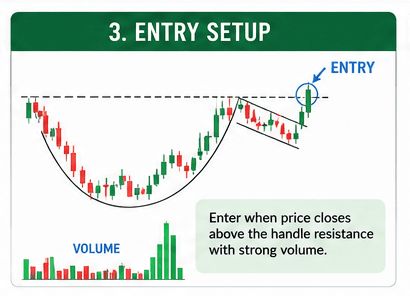
Different traders use different entry methods depending on their trading style and risk tolerance.
1. Aggressive Entry
Enter immediately after a strong breakout candle closes above the handle.
Advantages
- Early entry
- Higher profit potential
Disadvantages
- Greater risk of false breakout
2. Conservative Entry (Recommended)
Wait for:
- Breakout above resistance
- Pullback to the breakout level
- Bullish confirmation candle
Examples of confirmation candles:
- Bullish Engulfing
- Hammer
- Morning Star
This method generally provides better risk management.
3. Volume Confirmation Entry
Some professional traders wait for:
- Strong breakout
- Above-average volume
- Bullish candle close
This reduces the chances of entering weak breakouts.
Stop Loss Placement
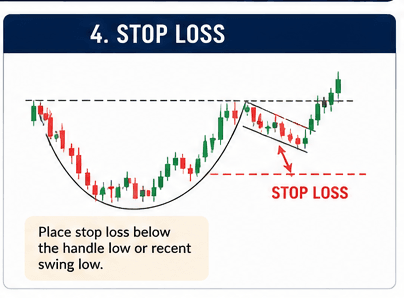
A proper stop-loss protects your capital when the trade doesn’t work as expected.
Several methods are commonly used.
Method 1: Below the Handle (Most Popular)
Place the stop-loss just below the lowest point of the handle.
This allows normal price fluctuations while protecting against failed breakouts.
Method 2: Below Recent Swing Low
Conservative traders sometimes place the stop-loss below the most recent swing low.
Although this increases the stop distance, it reduces the chances of being stopped out by minor market noise.
Method 3: ATR Stop Loss
Experienced traders use the Average True Range (ATR) indicator to calculate a volatility-based stop-loss.
This method adapts to changing market conditions.
Profit Target
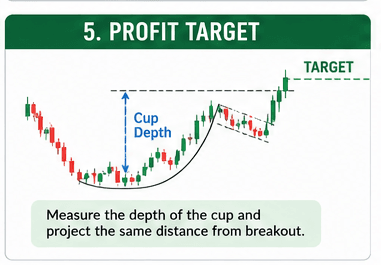
There are multiple methods to calculate profit targets.
Target 1 – Cup Height Method (Classic Method)
Measure:
Cup Depth
From:
Cup Bottom
↓
Resistance
Project the same distance upward from the breakout point.
This is the traditional Cup and Handle price target.
Example
Suppose:
Resistance = 500
Cup Bottom = 420
Cup Depth = 80
Breakout = 500
Target
500 + 80 = 580
Target 2 – Previous Swing High
If nearby resistance exists, traders often book partial profits before the previous swing high.
Target 3 – Trailing Stop
During strong trends:
Rather than exiting at a fixed target,
Professional traders trail the stop-loss using:
- 20 EMA
- Swing lows
- Trendline
This allows profits to grow during powerful rallies.
Cup and Handle Pattern with Candlestick Confirmation for Entry
While the Cup and Handle Pattern is a reliable bullish continuation pattern, entering a trade solely on the breakout can sometimes lead to false signals. Professional traders often wait for a bullish candlestick confirmation near the handle or at the breakout level before entering. This additional confirmation increases the probability of a successful trade by showing that buyers have regained control.
Why Use Candlestick Confirmation?
Candlestick patterns reveal the battle between buyers and sellers in real time. A bullish candlestick forming near the handle support or during the breakout indicates strong buying pressure and confirms that the breakout is more likely to succeed.
Benefits of candlestick confirmation:
- Reduces the risk of false breakouts.
- Improves entry timing.
- Provides a logical stop-loss level.
- Increases confidence in the trade setup.
- Works well with Fibonacci and volume analysis.
1. Bullish Engulfing Pattern
A Bullish Engulfing Pattern is one of the strongest confirmation signals.
Entry Rule
- The handle forms near resistance.
- A Bullish Engulfing candle appears at the handle support.
- The next candle closes above the engulfing candle’s high.
- Enter the trade after this confirmation.
Stop Loss
Below the low of the Bullish Engulfing candle.
Target
- Cup Height Projection
- Previous Swing High
- Fibonacci Extension (127.2% or 161.8%)
Why it works:
The engulfing candle shows buyers have completely absorbed selling pressure, often leading to a strong breakout.
2. Hammer Candlestick
A Hammer indicates that sellers pushed prices lower, but buyers regained control before the candle closed.
Entry Rule
- Hammer forms near handle support.
- The next candle closes above the Hammer’s high.
- Enter after confirmation.
Stop Loss
Below the Hammer’s low.
Best Used With
- Fibonacci 38.2%
- Fibonacci 50%
- Fibonacci 61.8%
- Trendline Support
3. Morning Star Pattern
The Morning Star Pattern is a powerful three-candle bullish reversal pattern.
Entry Rule
- Appears during the handle pullback.
- Third candle closes above the first candle’s midpoint.
- Breakout follows shortly after.
Stop Loss
Below the Morning Star’s low.
Why Traders Like It
It indicates that bearish momentum is weakening while buyers are taking control.
4. Piercing Line Pattern
The Piercing Line Pattern often appears after a brief decline in the handle.
Entry Rule
- Wait for the second candle to close above 50% of the previous bearish candle.
- Enter after breakout confirmation.
Stop Loss
Below the pattern’s low.
5. Tweezer Bottom
A Tweezer Bottom forms when two consecutive candles have nearly equal lows, suggesting strong support.
Entry Rule
- Forms at handle support.
- Bullish breakout follows.
- Enter after the breakout candle closes above resistance.
Step-by-Step Entry Strategy
Step 1
Identify a valid Cup and Handle Pattern.
↓
Step 2
Wait for the handle to form.
↓
Step 3
Look for a bullish candlestick pattern such as:
- Bullish Engulfing
- Hammer
- Morning Star
- Piercing Line
- Tweezer Bottom
↓
Step 4
Confirm increasing trading volume.
↓
Step 5
Wait for a breakout candle to close above the handle resistance.
↓
Step 6
Enter the trade on the breakout or on a small retest of the breakout level.
Example Trade Setup
Suppose ABC Ltd. rallies from 200 to 260, then forms a smooth cup and returns to the ₹260 resistance level. During the handle, the price retraces to 252, where a Bullish Engulfing Pattern appears with higher trading volume.
The next candle closes above the handle resistance at 261, confirming the breakout.
Trade Plan:
- Entry: 261 (after breakout confirmation)
- Stop Loss: 251 (below the Bullish Engulfing candle)
- Target 1: 320 (Cup Height Projection)
- Target 2: Trail the stop-loss if the trend remains strong
This setup combines chart structure, candlestick confirmation, and volume, making it a higher-probability trade than entering on the pattern alone.
Cup and Handle Pattern with Fibonacci Confirmation

Adding Fibonacci Retracement can significantly improve trade quality.
Instead of relying only on chart patterns, traders combine multiple confirmations.
Step 1
Draw Fibonacci Retracement
Swing Low
↓
Cup High
Step 2
Watch the Handle
The best handles usually retrace toward:
- 38.2%
- 50%
- 61.8% (Golden Zone)
These areas often attract institutional buying.
Step 3
Entry
Wait for:
- Fibonacci support
- Bullish candlestick
- Breakout above handle
Entry:
Above the confirmation candle.
Step 4
Stop Loss
Place the stop-loss:
- Below 61.8% Fibonacci
OR - Below the handle low
Step 5
Profit Target
Use:
- Cup Depth Projection
- Fibonacci Extension 127.2%
- Fibonacci Extension 161.8%
These are popular methods for identifying potential resistance levels after the breakout.
Volume Analysis
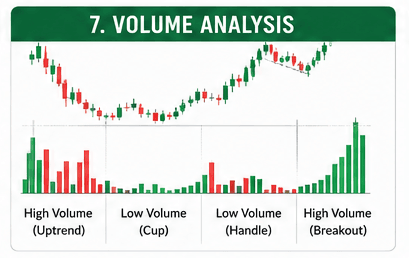
Volume is one of the most important confirmation tools.
A strong Cup and Handle Pattern usually follows this sequence:
| Stage | Expected Volume |
|---|---|
| Uptrend | High |
| Cup Formation | Gradually decreases |
| Bottom of Cup | Lowest volume |
| Recovery | Slowly increases |
| Handle | Low volume |
| Breakout | Sharp increase |
A breakout with rising volume indicates strong buying interest.
Real Trading Example
Suppose a stock rallies from 800 to 1,000.
After the rally, it gradually declines to 900, forming the left side of the cup. Over the next several sessions, buyers return, and the price climbs back to 1,000, completing the rounded cup.
Near this resistance, the stock pulls back modestly to 975, creating the handle.
A few days later, the price closes above 1,000 with higher-than-average trading volume.
A trader using a conservative approach waits for the breakout confirmation and enters at 1,005.
The stop-loss is placed below the handle low at 970.
The depth of the cup is:
1,000 − 900 = 100
Projecting this distance from the breakout level gives a target of:
1,000 + 100 = 1,100
This setup offers a clear entry, a logical stop-loss, and an objective profit target, making it easier to manage the trade with discipline.
Best Timeframes for Trading the Cup and Handle Pattern
The Cup and Handle Pattern can appear on any timeframe, but its reliability generally improves on higher timeframes because they filter out market noise.
5-Minute Chart
Suitable for scalpers looking for quick intraday opportunities. However, false breakouts are more common due to short-term volatility.
15-Minute Chart
A popular choice for intraday traders. It offers a balance between trade frequency and reliability.
1-Hour Chart
One of the most widely used timeframes among swing traders. It produces cleaner chart structures while still offering regular trading opportunities.
4-Hour Chart
Preferred by many professional traders because patterns are generally more reliable and less affected by random price fluctuations.
Daily Chart
The Daily timeframe often provides the strongest Cup and Handle setups. Although opportunities occur less frequently, the resulting trends can be substantial.
Markets Where the Cup and Handle Pattern Works Best
This pattern is versatile and can be applied across different financial markets.
Stocks
Commonly used to identify bullish continuation opportunities in individual company shares.
Forex
Works well in major currency pairs due to their high liquidity, though traders should consider economic news that may affect price movements.
Cryptocurrencies
Frequently observed in Bitcoin, Ethereum, and other major cryptocurrencies. Because crypto markets are highly volatile, confirmation with volume and risk management is especially important.
Commodities
The pattern can also appear in markets such as gold, silver, crude oil, and natural gas.
Indices
Major indices like the Nifty 50, Bank Nifty, S&P 500, and Nasdaq often form Cup and Handle Patterns during sustained bullish trends.
Advantages and Disadvantages of the Cup and Handle Pattern
Advantages
- Clearly defined bullish continuation pattern
- Provides logical entry, stop-loss, and target levels
- Works across multiple financial markets
- Suitable for swing and position traders
- Easy for beginners to recognize
- Can be combined with indicators for stronger confirmation
Disadvantages
- False breakouts can occur
- Pattern formation may take weeks or months
- Deep handles reduce reliability
- Less effective in sideways markets
- Requires patience and disciplined execution
Common Mistakes Beginners Make
Many traders struggle with this pattern not because it doesn’t work, but because they fail to follow proper trading discipline.
Entering Before the Handle Forms
Some traders buy as soon as the cup is completed. Waiting for the handle provides stronger confirmation.
Ignoring Volume
A breakout without increasing volume is generally less reliable.
Placing Stop-Loss Too Close
A very tight stop-loss can result in exiting the trade during normal price fluctuations.
Trading Without Confirmation
Always wait for the breakout candle to close above resistance instead of entering during the breakout.
Chasing Extended Breakouts
Entering after a large breakout candle may lead to poor risk-to-reward ratios.
Cup and Handle Pattern vs Rounded Bottom
Although both patterns appear similar, they serve different purposes.
| Feature | Cup and Handle | Rounded Bottom |
|---|---|---|
| Pattern Type | Bullish Continuation | Bullish Reversal |
| Handle Present | Yes | No |
| Breakout Confirmation | Stronger | Moderate |
| Entry Point | Handle Breakout | Resistance Breakout |
| Reliability | High | Medium to High |
Cup and Handle Pattern vs Ascending Triangle
| Feature | Cup and Handle | Ascending Triangle |
|---|---|---|
| Structure | Rounded Cup + Handle | Horizontal Resistance + Rising Support |
| Breakout | Above Handle | Above Resistance |
| Psychology | Accumulation | Increasing Buying Pressure |
| Formation Time | Longer | Shorter |
| Reliability | High | High |
Best Indicators to Combine with the Cup and Handle Pattern
Using additional indicators can improve trade quality by providing extra confirmation.
Volume
Increasing volume during the breakout confirms strong buying interest.
RSI (Relative Strength Index)
RSI helps determine whether momentum supports the breakout. A reading above 50 often indicates strengthening bullish momentum.
Moving Averages
The 20 EMA and 50 EMA can act as dynamic support during the handle formation.
MACD
A bullish MACD crossover during the breakout provides additional confirmation.
Fibonacci Retracement
The 38.2%, 50%, and 61.8% retracement levels often align with healthy handle pullbacks.
Risk Management Tips
Even high-quality patterns can fail. Proper risk management helps protect your trading capital.
- Risk only 1–2% of your trading capital on a single trade.
- Always use a predefined stop-loss.
- Aim for a minimum 1:2 risk-to-reward ratio.
- Avoid overtrading.
- Keep a trading journal to review your decisions and improve over time.
Professional Trading Checklist
Before entering a Cup and Handle trade, ask yourself:
- ✔ Is there a clear uptrend before the pattern?
- ✔ Is the cup smooth and rounded?
- ✔ Is the handle shallow?
- ✔ Has the price closed above the handle resistance?
- ✔ Is breakout volume higher than average?
- ✔ Is the stop-loss placed below the handle?
- ✔ Does the trade offer at least a 1:2 risk-to-reward ratio?
- ✔ Are there no major economic or company-specific news events that could disrupt the setup?
If several of these conditions are missing, consider waiting for a stronger opportunity.
Pro Tips for Trading the Cup and Handle Pattern
Experienced traders often follow these guidelines:
- Focus on higher-timeframe patterns for greater reliability.
- Wait for the breakout candle to close before entering.
- Combine the pattern with volume analysis and support/resistance levels.
- Avoid chasing price after a large breakout candle.
- Be patient—quality setups take time to develop.
- Remember that no pattern guarantees success; disciplined execution is more important than predicting every move.
Frequently Asked Questions (FAQs)
Is the Cup and Handle Pattern reliable?
Yes. It is considered one of the more reliable bullish continuation patterns when confirmed by increased volume and a decisive breakout.
Which timeframe works best?
The 1-hour, 4-hour, and Daily charts generally produce stronger and more reliable signals.
Can beginners trade the Cup and Handle Pattern?
Yes. Its clearly defined structure and straightforward entry and exit levels make it suitable for beginners who follow proper risk management.
Does the Cup and Handle Pattern work in cryptocurrency?
Yes. It appears in cryptocurrencies, stocks, forex, commodities, and indices, though higher volatility in crypto requires careful confirmation.
What is the ideal handle depth?
The handle is generally considered healthier when it retraces less than one-third of the cup and remains relatively shallow.
Why is volume important?
Higher volume during the breakout suggests stronger buying interest and increases confidence in the trend’s continuation.
Can I combine RSI with the Cup and Handle Pattern?
Yes. RSI can help confirm bullish momentum and reduce the likelihood of entering weak breakouts.
What is the profit target?
A common approach is to measure the cup’s depth and project that distance upward from the breakout level. Fibonacci extension levels can also be used as additional target zones.
Final Thoughts
The Cup and Handle Pattern is more than just a recognizable chart formation—it reflects the market’s transition from profit booking to renewed buying interest. The rounded cup shows that selling pressure is gradually absorbed, while the handle represents a final consolidation before buyers attempt to push prices higher.
Although the pattern has a strong historical reputation, no technical setup guarantees success. Waiting for a confirmed breakout, managing risk carefully, and combining the pattern with tools such as volume analysis, RSI, moving averages, and Fibonacci retracement can improve decision-making.
Successful trading is built on consistency, discipline, and continuous learning. Rather than relying on a single pattern, use the Cup and Handle Pattern as one part of a broader trading plan that includes sound risk management and objective analysis.