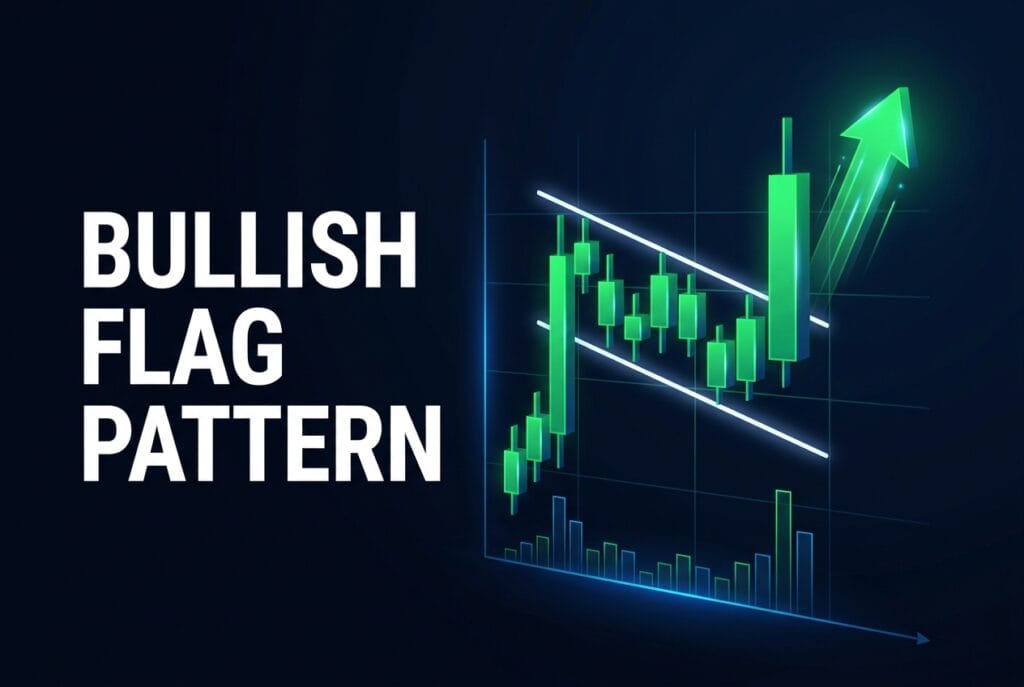
If you’ve spent any time staring at charts, you’ve probably noticed something strange — the market almost never moves in a straight line. It moves in bursts, pauses, and then bursts again. That short pause after a big rally? That’s often a bullish flag pattern — and it’s one of the most trusted continuation patterns in technical analysis.
In this guide, I’m going to walk you through this pattern the way I’d explain it to a friend sitting next to me — no jargon dump, no textbook copy-paste. Just clear, practical trading knowledge you can actually use tomorrow morning.
What Is a Bullish Flag Chart Pattern?
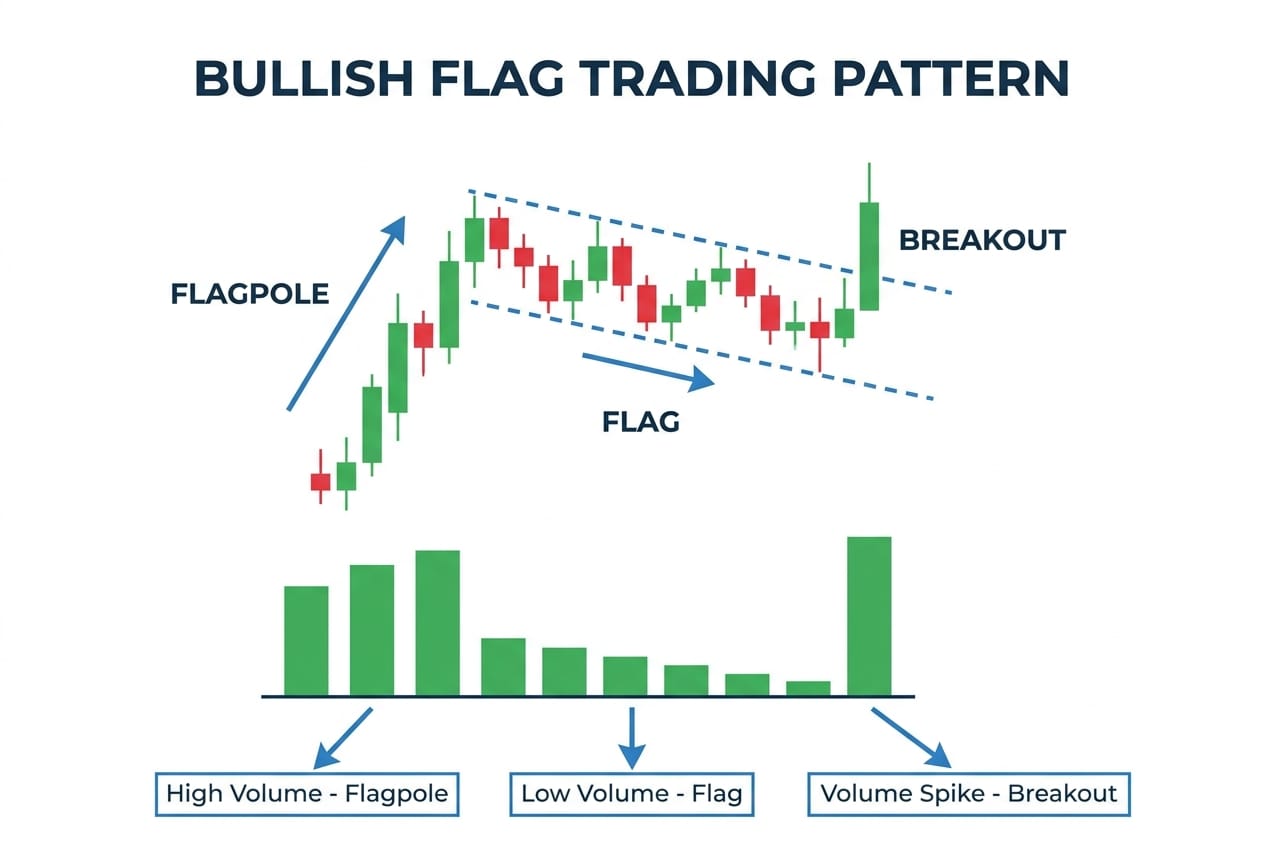
A bullish flag is a short-term continuation pattern that shows up after a sharp upward move in price. Imagine a stock running up 10% in two days. It doesn’t just keep running forever — it slows down, drifts slightly downward or sideways for a while, and then, if the trend is still healthy, it takes off again. That short pause in the middle is the “flag.” The sharp rally before it is the “flagpole.”
Put both together, and it looks exactly like a flag on a pole — which is where the name comes from.
The Two Building Blocks of a Bullish Flag
Every real bullish flag has exactly two parts. Miss one and you’re probably looking at something else.
1. The Flagpole
This is the strong, near-vertical rally that starts the pattern. The steeper and cleaner the rally, the more reliable the flag. A slow, choppy rise doesn’t count — you want something that looks like a rocket taking off. Usually, this move is backed by heavy volume, news, earnings, or some kind of trigger that pushes buyers in aggressively.
2. The Flag
After the flagpole, price cools off inside a small, tight channel. This channel usually slopes slightly downward against the trend, or sometimes moves sideways. Volume during the flag drops noticeably — because sellers aren’t aggressive, they’re just profit-takers.
How to Spot a Real Bullish Flag on the Chart
- Look for a sharp, clean rally (the pole)
- Followed by 5 to 20 candles of small-range consolidation (the flag)
- Two parallel trendlines should fit nicely across the highs and lows of the flag
- Volume should shrink inside the flag
For chartview visit Trading view –https://www.tradingview.com/
Why This Pattern Matters for Traders
Because it does two things at once — it tells you the trend is strong, and it gives you a clean entry point with a defined stop loss and target. Most patterns give you either direction or entry precision. The bullish flag gives you both. That’s rare, and that’s why professional traders love it.
The Psychology Behind the Bullish Flag Pattern
This is the section 90% of traders skip — and it’s the reason they keep losing. Chart patterns don’t work because of the shape. They work because human emotions repeat over and over again. Once you understand why a bullish flag forms, you’ll stop trading it mechanically and start reading it like a story.
Stage 1 – The Rally (Flagpole)
Something big happens. Maybe it’s a positive earnings surprise. Maybe it’s a breakout above a major resistance. Maybe it’s a sector-wide rally or a strong news event. Whatever the trigger, buyers rush in aggressively.
At the same time, short sellers who were betting against the stock start panicking. They cover their positions by buying back — which fuels the rally even more. This double effect — fresh buyers + panicked short covering — creates that near-vertical flagpole.
Volume during this phase is huge. Everyone wants a piece of the action.
Stage 2 – The Pause (Flag Formation)
Now the interesting part starts. Price has moved a lot in a short time. Early buyers who caught the bottom start thinking, “Let me book some profit, this looks stretched.” At the same time, new buyers hesitate because price already moved so much. They think, “I missed the move, let me wait for a pullback.”
This creates a small, controlled pullback. Sellers here are not aggressive sellers — they’re just profit-takers. There’s no fresh selling pressure. That’s why the pullback stays shallow and the volume drops.
Meanwhile, smart money — funds, institutions, professional traders — quietly accumulates during this phase. They don’t chase the top; they wait for the pause and load up in the flag.
Stage 3 – The Breakout
Eventually, profit-booking dries up. There’s nobody left to sell at these prices. Buyers realise the stock isn’t dropping further, and the trend is still alive. Fresh buying comes in, sometimes triggered by news, sometimes just by momentum traders spotting the breakout.
Price breaks above the flag’s upper trendline. Volume spikes. Short sellers get squeezed again. And the next leg of the trend begins.
The One-Line Summary
A bullish flag is what happens when strong hands quietly accumulate while weak hands take profit.
Once you internalise this, you’ll never look at a flag the same way again.
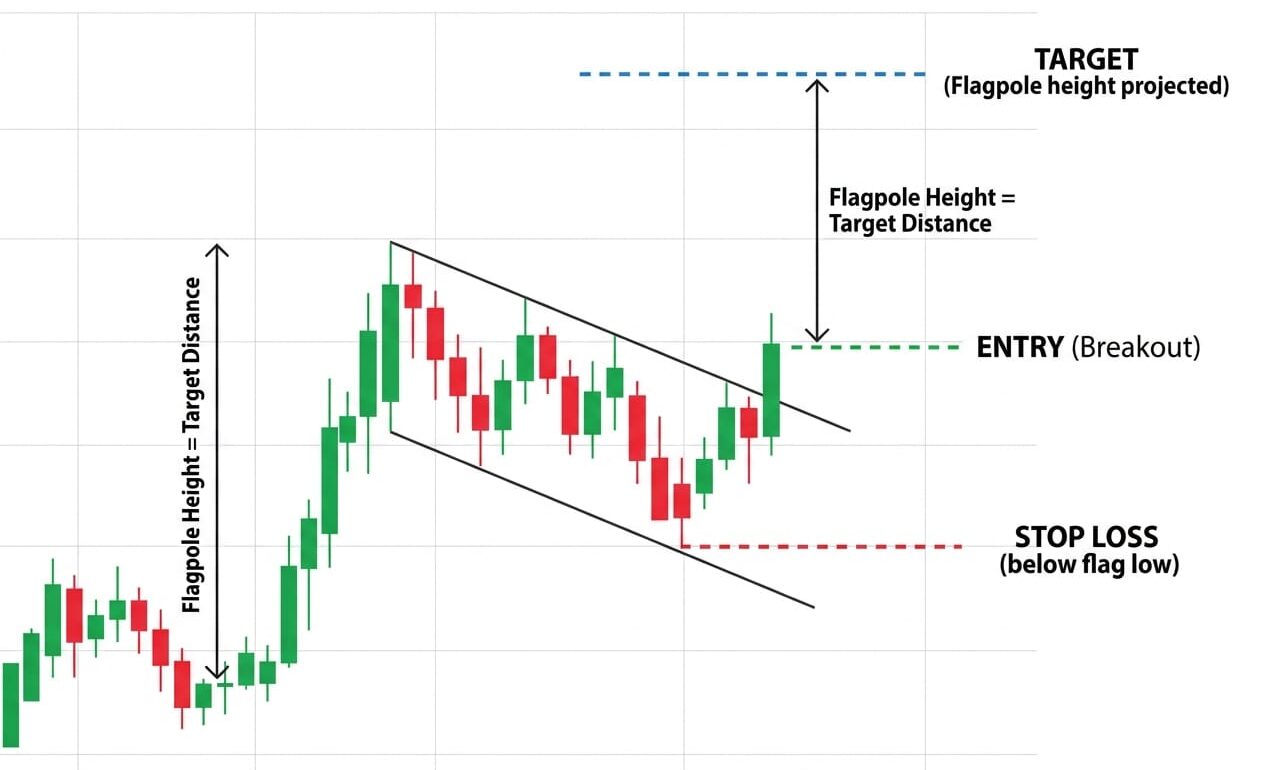
Entry, Stop Loss and Target – Full Structure With Diagram
This is where theory meets money. Let’s break down exactly how to trade a bullish flag from A to Z.
Entry Rules
There are two schools of thought here — aggressive and conservative. Both work, but they suit different personalities.
Aggressive Entry (Breakout Entry)
Enter the moment price breaks above the upper trendline of the flag with a strong bullish candle and rising volume. This catches the fastest moves, but you’ll also get more fakeouts.
Rules:
- Breakout candle should close above the upper trendline
- Volume on breakout should be higher than the average of the last 10 candles
- No long upper wick on the breakout candle
H4: Safe Entry (Retest Entry)
Wait for the breakout, then wait for price to come back and retest the breakout line. If price holds above it, enter. Fewer fakeouts, but you may sometimes miss fast movers.
Rules:
- Wait for the initial breakout candle to close
- Wait for 1–3 candles of pullback to the broken line
- Enter when a bullish candle forms at the retest
Stop Loss Placement
Getting this right is the difference between a trader who survives and one who blows up. There are two safe zones:
- Below the lower trendline of the flag – most common and reliable
- Below the most recent swing low inside the flag – gives a slightly wider stop but avoids random wicks
Never place your stop loss inside the flag. Normal market noise will stop you out even when the pattern is working.
Target Calculation
The target is beautifully simple — and this is why the pattern is loved by so many traders.
Formula: Target = Breakout Price + Flagpole Height
Measure the vertical distance from the start of the flagpole to its peak. Add that same distance from your breakout entry, and that’s your target.
Real Example With Numbers
Let’s say Reliance stock:
- Starts the flagpole at ₹2,400
- Runs up to ₹2,500 (flagpole height = ₹100)
- Consolidates in a flag between ₹2,470 and ₹2,495
- Breaks out at ₹2,495
Your setup:
- Entry: ₹2,495
- Stop Loss: ₹2,465 (just below flag low)
- Target: ₹2,495 + ₹100 = ₹2,595
- Risk: ₹30
- Reward: ₹100
- Risk-to-Reward: 1 : 3.3
Advanced Tip – Partial Booking
Most professional traders don’t exit fully at the target. They book 50% at the calculated target and trail the rest with a moving average (like 20 EMA) or with a shifting stop loss. This way, if the trend continues for 3–4x the flagpole, they capture the extra move.
When to Trade the Bullish Flag Pattern
Not every day is a good day to trade a bullish flag. The market condition matters just as much as the pattern itself.
Bullish Market – The Best Environment
This is where the bullish flag thrives. During a strong uptrend — whether it’s on Nifty, Bank Nifty, or individual stocks — flags act as continuation patterns and offer some of the cleanest breakouts in technical analysis.
Why it works so well in bull markets:
- Buyers dominate every dip
- News flow tends to be positive
- Institutional flows are supportive
- Retail sentiment is optimistic, adding fuel to breakouts
If you’re trading a bullish flag during a healthy bull trend on the daily chart, you’re stacking probabilities in your favour.
Sideways Market – Trade With Caution
In a sideways market, flags may still form, but breakouts often fail. Price breaks above the upper trendline, moves a bit, and then drops back into the range. This is called a false breakout or fakeout.
How to trade flags in sideways markets:
- Only take setups near the lower boundary of the range
- Book profits quickly — don’t wait for the full target
- Use tighter stop losses
- Skip if volume is not confirming
Honestly, if the market is choppy for weeks, you’re better off waiting for clarity.
Bearish Market – Better to Avoid
Bullish flags in a downtrend are usually bull traps. Price breaks out, sucks in retail buyers, and then reverses hard. Even if a real breakout happens, the follow-through is weak because sellers are still in control on higher timeframes.
Rule of thumb: if the daily or weekly chart is bearish, ignore bullish flag signals on lower timeframes.
Best Timeframes for Bullish Flags
Different timeframes suit different trading styles:
Intraday Traders
- 5-minute chart: For scalping, especially in the first two hours of the session
- 15-minute chart: The sweet spot for most intraday traders
Swing Traders
- 1-hour chart: Great for 2–5 day trades
- 4-hour chart: Excellent for 1–2 week trades
- Daily chart: Best for larger swing moves lasting 2–6 weeks
Positional Traders
- Weekly chart: Rare, but when a bullish flag forms on the weekly chart, the move that follows can last months
Bullish Flag + RSI Combined Strategy (Entry, Stop Loss & Target)
RSI (Relative Strength Index) is one of the most reliable momentum indicators, and pairing it with a bullish flag can filter out weak setups beautifully.
What RSI Actually Tells You
RSI measures the speed and change of price movements on a scale of 0 to 100. In simple words:
- Above 50 – bulls are in control
- Below 50 – bears are in control
- Above 70 – overbought (but in strong trends, it can stay overbought for a long time)
- Below 30 – oversold
For bullish flags, the key level is 50. RSI staying above 50 during the flag consolidation is a strong sign that the uptrend is still alive.
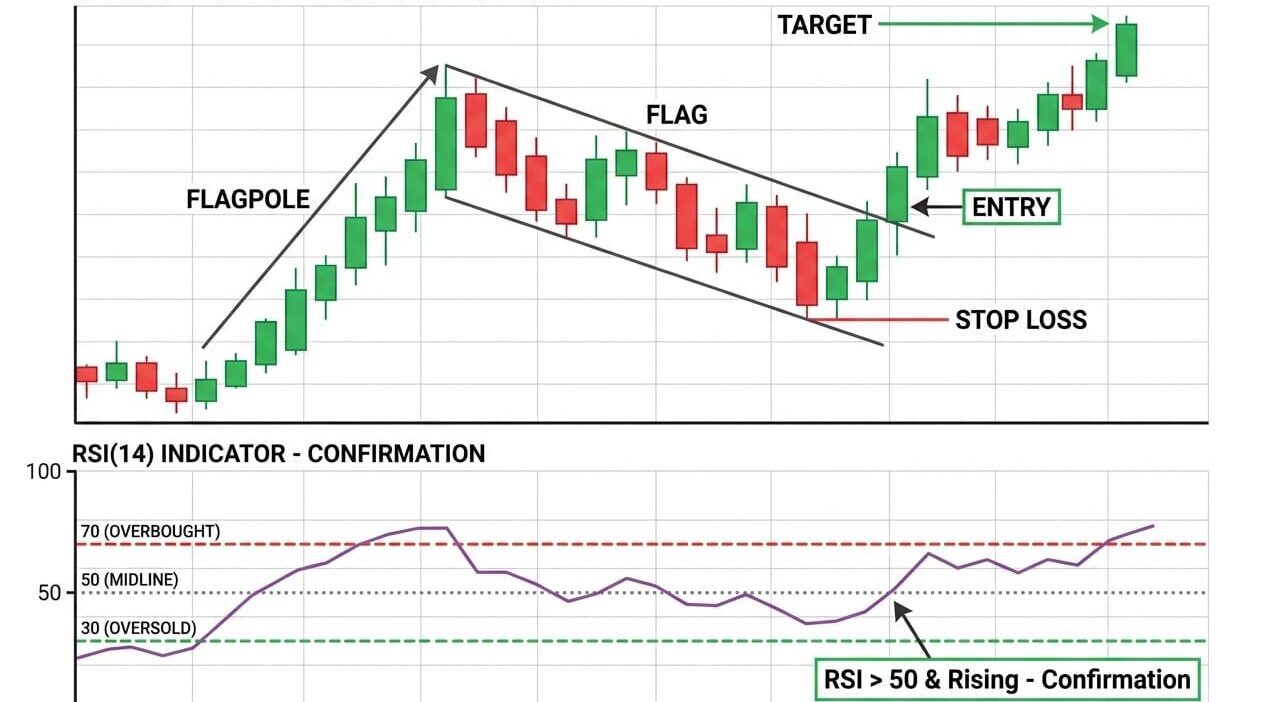
Entry Rules Using RSI Confirmation
Take the trade only when all three conditions align:
- Price breaks above the flag’s upper trendline (chart signal)
- RSI is above 50 and rising (momentum signal)
- Bonus: RSI breaks its own downward trendline drawn during the flag (super strong confirmation)
If RSI is below 50 during the breakout, the move is weak — skip it, no matter how pretty the chart looks.
Stop Loss Placement
- Place stop loss below the flag’s lower trendline (same as the pure price action strategy)
- Alternatively, exit the trade if RSI drops back below 50 after your entry — that’s an early warning that momentum is fading
Target Strategy Using RSI
- Primary target: Flagpole height projected from breakout (same as before)
- Partial booking: Book 50% of your position when RSI crosses above 70 and starts curling downward
- Trail the rest: Hold the remaining position as long as RSI stays above 50
Full Example With Numbers
- Stock: HDFC Bank
- Flagpole: ₹1,600 → ₹1,660 (₹60 move)
- Flag: consolidates between ₹1,645 and ₹1,655
- Breakout: ₹1,655
- RSI at breakout: 62 (rising)
Trade setup:
- Entry: ₹1,655
- Stop Loss: ₹1,640
- Target 1 (partial): ₹1,700 (when RSI hits 70)
- Final Target: ₹1,715 (flagpole projection)
Why This Combo Works So Well
Price action tells you where to enter. RSI tells you whether the move has strength behind it. Together, they filter out about 60–70% of the fake breakouts that would otherwise stop you out.
Bullish Flag + EMA Combined Strategy (Entry, Stop Loss & Target)
EMA (Exponential Moving Average) is my personal favourite for confirming trend direction. Combined with a bullish flag, it becomes an incredibly powerful setup.
Which EMAs to Use
We’ll use two EMAs together:
- 20 EMA – short-term trend
- 50 EMA – medium-term trend
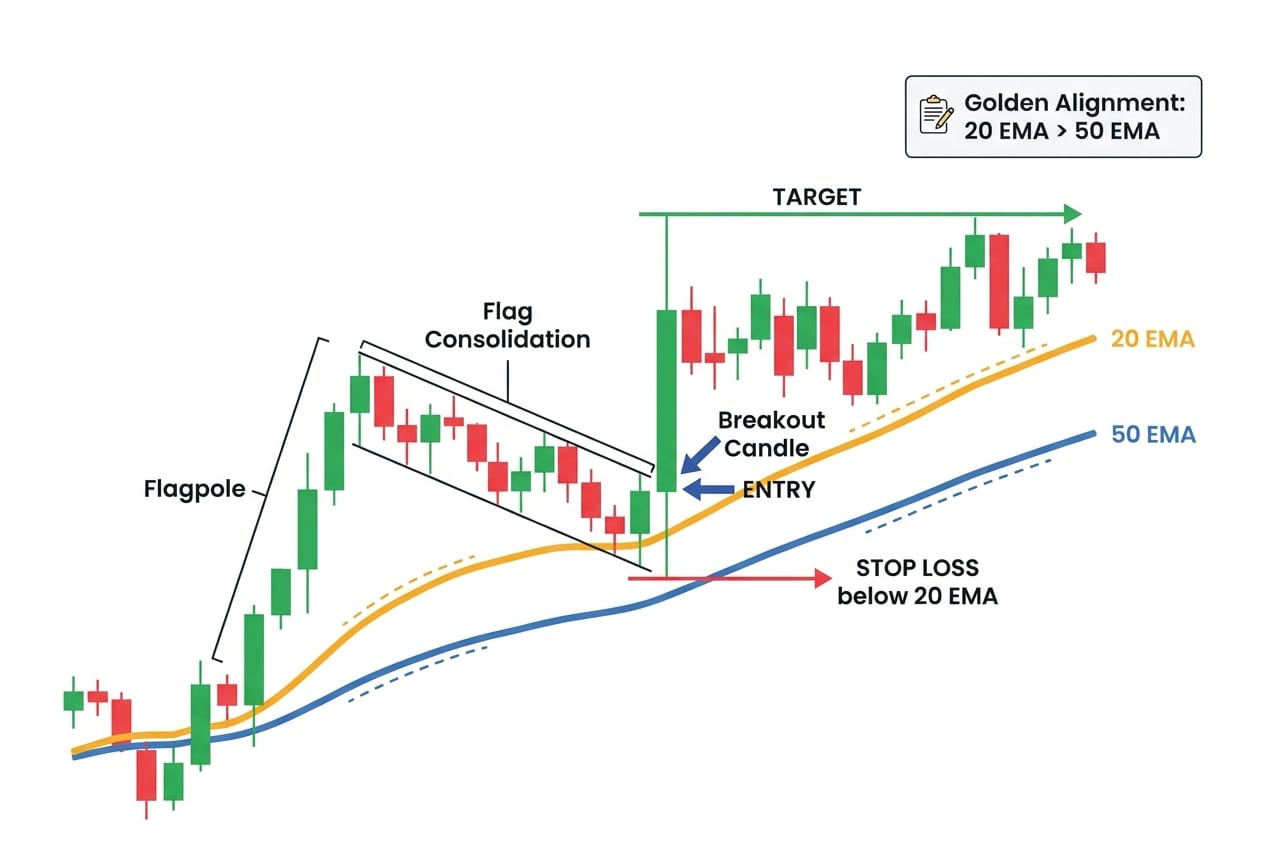
When 20 EMA is above 50 EMA and both are rising, the trend is clearly bullish. This is often called “golden alignment.”
Entry Rules Using EMA Confirmation
Take the trade only when all these conditions are true:
- Price breaks above the flag’s upper trendline
- Price is trading above both 20 EMA and 50 EMA
- 20 EMA is above 50 EMA (golden alignment)
- Both EMAs are sloping upward, not flat
If price is below the EMAs during a “flag,” it’s not really a bullish flag — it’s a dead-cat bounce inside a downtrend. Skip it.
Stop Loss Placement
You have two options:
- Below the flag’s lower trendline – standard placement
- Below the 20 EMA – dynamic placement that adjusts as the trend develops
Use whichever is lower on the chart. This gives your trade enough room to breathe.
Target Strategy Using EMA
- Primary target: Flagpole height projected from breakout
- Trailing target: Hold as long as price stays above 20 EMA
- Exit trigger: Close the trade when price closes below the 20 EMA on your trading timeframe
Full Example With Numbers
- Stock: Infosys
- Flagpole: ₹1,500 → ₹1,570 (₹70 move)
- Flag: consolidates between ₹1,555 and ₹1,568
- Breakout: ₹1,568
- 20 EMA: ₹1,545 (above 50 EMA at ₹1,520)
Trade setup:
- Entry: ₹1,568
- Stop Loss: ₹1,545 (below 20 EMA)
- Target 1: ₹1,638 (flagpole projection)
- Trailing: Continue holding as long as price stays above 20 EMA
Why EMAs Add So Much Value
EMAs act as dynamic support levels. When price pulls back to the 20 EMA and bounces, it’s usually a great re-entry opportunity. The EMA strategy also lets you ride bigger trends because you don’t exit at a fixed target — you exit only when the trend actually breaks.
Bonus – Using EMA for Re-Entry
If you missed the first breakout, don’t chase. Wait for price to pull back to the 20 EMA. If it bounces off with a bullish candle, that’s a second chance to enter with even better risk-to-reward.
Risk-to-Reward Ratio of the Bullish Flag Pattern
Risk-to-reward is where the bullish flag really shines. Let’s break down why professional traders love this pattern from a pure math perspective.
What Is Risk-to-Reward Ratio?
It’s the amount you’re willing to lose (risk) compared to the amount you expect to make (reward). If you’re risking ₹100 to potentially make ₹300, your risk-to-reward is 1:3.
Typical Risk-to-Reward for Bullish Flags
Because the stop loss is tight (just below the flag) and the target is far (equal to the flagpole), most bullish flag setups naturally give you a risk-to-reward between 1:2 and 1:5.
H3: Real Example Table
| Parameter | Value |
|---|---|
| Flagpole Move | ₹100 → ₹120 (₹20) |
| Entry (Breakout) | ₹118 |
| Stop Loss | ₹114 |
| Target | ₹138 |
| Risk | ₹4 |
| Reward | ₹20 |
| Risk : Reward | 1 : 5 |
Why This R:R Is Powerful
Let’s do some quick math. Suppose you take 10 bullish flag trades with a 1:3 risk-to-reward:
- You risk ₹1,000 per trade
- Even if you win only 4 out of 10 trades, you make 4 × ₹3,000 = ₹12,000
- Your total losses on 6 trades = 6 × ₹1,000 = ₹6,000
- Net profit = ₹6,000
You don’t need to be right most of the time. You just need to be right enough. That’s the beauty of asymmetric risk-to-reward.
Position Sizing Rule
Never risk more than 1–2% of your capital on a single trade. If your capital is ₹1,00,000, your risk per trade should be ₹1,000–₹2,000. This way, even a string of 5 losses won’t damage your account meaningfully.
Common Mistakes Traders Make With Bullish Flags
Learning from other people’s mistakes is way cheaper than making them yourself. Here are the top mistakes I’ve seen traders make with this pattern.
Mistake 1 – Entering Without Volume Confirmation
A breakout without volume is like a car without fuel — it looks fine standing still, but it won’t go anywhere. Always check that the breakout candle has higher volume than the previous 10 candles.
Mistake 2 – Ignoring the Higher Timeframe Trend
A bullish flag on a 15-minute chart means nothing if the daily chart is in a strong downtrend. Always align your setup with the higher timeframe. Trend on daily > trend on 15-min.
Mistake 3 – Using a Stop Loss That’s Too Tight
Traders often place their stop loss inside the flag to “reduce risk.” What actually happens is they get stopped out by normal noise, and then watch the trade hit the target without them. Give the trade room.
Mistake 4 – Chasing a Late Breakout
If price has already moved 3–4% above the breakout point and you’re just noticing it now, don’t chase. Wait for a retest or move on. Late entries almost always result in poor risk-to-reward.
Mistake 5 – Not Booking Partial Profits
Greed kills more traders than fear. When you’re up 60–70% of the way to your target and the market shows exhaustion, book some profits. You don’t have to hit the exact target every time.
How to Identify a Fake Bullish Flag (Fakeouts)
Every trader eventually gets burned by a fake bullish flag. Here’s how to avoid most of them.
Warning Signs of a Fake Bullish Flag
- Weak flagpole – if the initial rally is choppy or slow, the “flag” that follows won’t act like a flag
- Flag lasts too long – if consolidation goes beyond 20–25 candles, the setup weakens and often turns into a rectangle or wedge
- Long upper wick on breakout candle – means sellers were active at the top, likely a rejection
- Volume drops on breakout – no conviction, no follow-through
- Bearish market context – bullish flags in downtrends usually fail
- Price breaks the flag’s lower trendline first – if this happens, the pattern is invalidated
What to Do When a Breakout Fails
Exit immediately. Don’t wait, don’t hope. A failed bullish flag can turn into a sharp reversal, especially if trapped buyers rush to exit.
The “Second Chance” Rule
Sometimes a bullish flag fails on the first breakout, consolidates a bit more, and then breaks out cleanly on the second attempt. If the second attempt has strong volume and a clean candle, it’s often even more reliable than the first. Watch for this — it’s a hidden edge most traders miss.
Frequently Asked Questions (FAQ)
1. Is the bullish flag a reversal or continuation pattern?
It’s a continuation pattern. It appears during uptrends and signals the trend is likely to continue after a short pause.
2. How long does a bullish flag usually take to form?
Anywhere from 5 to 20 candles. If it drags on longer than that, the pattern loses reliability and may turn into a different formation like a rectangle or wedge.
3. Can I trade a bullish flag in intraday?
Yes, absolutely. It works very well on 5-minute and 15-minute charts, especially in stocks or indices that are already trending strongly during the session.
4. What is the success rate of the bullish flag pattern?
Studies and trader data suggest the success rate is between 65% and 75% when combined with proper volume and trend confirmation. Without confirmation, it drops to around 50%.
5. Should I enter at breakout or wait for the retest?
Breakout entry catches faster moves but comes with more false signals. Retest entry is safer but you might miss the trade sometimes. Beginners are better off with retest entry until they get comfortable reading price action.
6. What’s the difference between a bullish flag and a bullish pennant?
A flag is formed by two parallel trendlines (like a rectangle sloping slightly down). A pennant is formed by two converging trendlines (like a small symmetrical triangle). The psychology behind them is similar, but flags are usually cleaner and easier to trade.
7. Does the bullish flag work in crypto?
Yes — arguably even better than in stocks. Crypto markets trend strongly and volatile, and bullish flags in crypto often produce explosive breakouts. Just remember, volatility cuts both ways, so risk management is critical.
8. What timeframe gives the best bullish flag setups?
For swing trading, the daily and 4-hour charts are the sweet spot. For intraday, the 15-minute chart is ideal. For scalping, 5-minute can work but requires quick execution.
9. Can the bullish flag fail? What causes failure?
Yes, any pattern can fail. Common reasons include weak volume, unfavourable market context, sudden news events, over-extended flagpoles, or flags that lasted too long. Always have a stop loss in place.
10. Do I need volume to confirm the pattern?
Yes, strongly. Volume is the fuel of any breakout. A breakout without a volume spike is a warning sign — it usually means the move lacks conviction and could easily reverse.
11. How steep should the flagpole be?
The steeper, the better. A near-vertical flagpole indicates strong buying pressure and a real breakout in progress. A slow, gentle rise doesn’t count as a proper flagpole.
12. What is the ideal risk-to-reward ratio for this pattern?
Minimum 1:2. Realistic setups often give 1:3 to 1:5. If your setup gives less than 1:2, it’s probably not worth taking.
13. Can I use MACD instead of RSI?
Yes. A bullish MACD crossover during the breakout is a solid confirmation. RSI generally reacts faster than MACD, but MACD gives fewer false signals. Some traders even use both together.
14. Should I trade the bullish flag in options or futures?
Both work. Options traders can use it for directional buying (buying calls or bull call spreads). Futures traders can ride bigger moves with leverage. Either way, manage your position size carefully.
15. Is this pattern useful for long-term investors?
Not really. The bullish flag is primarily a short-to-medium term trading tool. Long-term investors care much more about fundamentals like earnings, cash flow, and management quality than chart patterns.
16. What indicator combination is best for the bullish flag?
The most reliable combo is Volume + 20 EMA + RSI(14). If all three agree with the price action, the setup becomes very high-probability.
17. Can I trade the bullish flag on Nifty and Bank Nifty?
Yes, especially on the 15-minute and 1-hour charts during trending sessions. Avoid trading it on expiry days or during major news events when volatility is unpredictable.
H3: 18. What happens if the price breaks below the flag instead of above?
Then the pattern is invalidated. If you were already in the trade, exit immediately. Sometimes a failed bullish flag turns into a sharp reversal, so don’t wait around hoping.
19. How do I know the flag is not just random consolidation?
A true flag has three markers: a strong flagpole before it, clean parallel trendlines during it, and shrinking volume inside it. If any of these are missing, it’s probably just a random range.
20. Do I need advanced software to trade the bullish flag?
Not at all. Any basic charting platform — TradingView, Zerodha Kite, Upstox, MetaTrader, Chartink — works fine. The pattern shows up on all of them.
21. How much capital do I need to trade this pattern?
There’s no fixed minimum. You can start with as little as ₹10,000 if you’re trading small quantities. What matters is risk management — never risk more than 1–2% of your capital on a single trade.
22. Can I automate bullish flag trading?
Yes, but it’s harder than it sounds. Automating pattern recognition requires either coding your own algorithm or using platforms with pattern-scanning features. Even then, human judgement usually outperforms fully automated pattern trading in the short run.
Final Thoughts
The bullish flag isn’t magic. It’s not going to make you rich overnight, and it’s not going to work every single time. But it is one of the cleanest, most logical, and highest-probability patterns in technical analysis — as long as you respect the rules.
Here’s my honest advice after years of watching charts:
- Wait for the pattern to fully form. Don’t jump early.
- Always confirm with volume and trend context.
- Use tight but sensible stop losses.
- Book partial profits and let winners run.
- Stay away from bullish flags in bear markets.
Trade patiently. Wait for confirmation. Respect your stop loss. That’s the whole game.
Whether you’re a beginner just learning to read charts or an experienced trader looking to refine your edge, the bullish flag deserves a permanent place in your trading playbook.