What is a Hammer Candlestick Pattern?
The Hammer Candlestick Pattern is one of the most popular and reliable single candlestick reversal patterns used in technical analysis. It typically appears after a prolonged downtrend and signals that selling pressure is weakening while buyers are beginning to take control of the market.
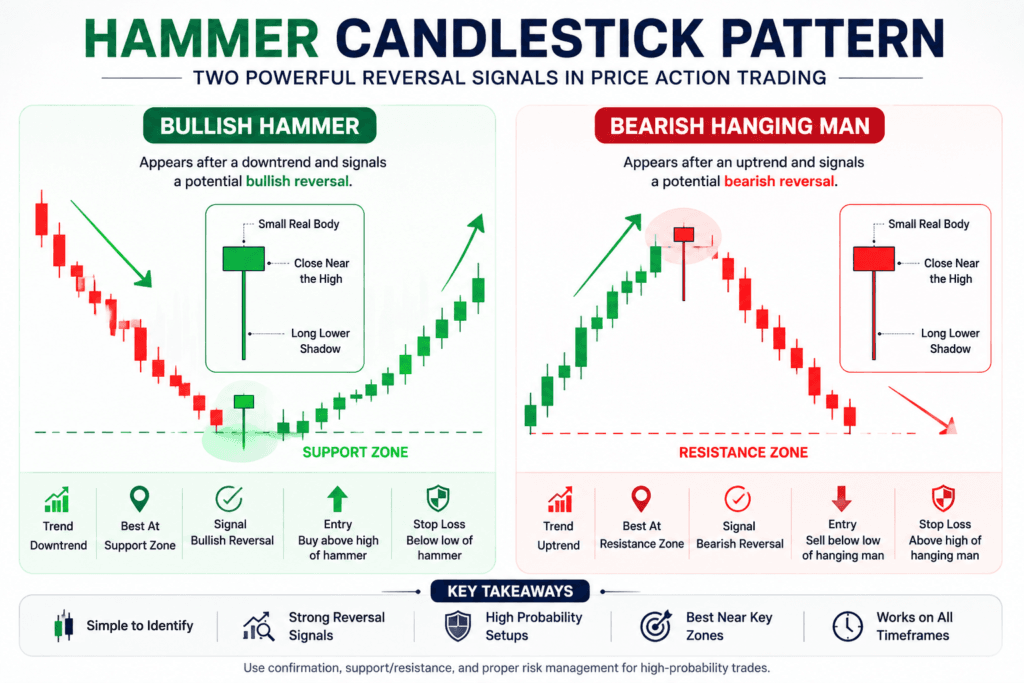
A hammer candle has a small real body near the top of the candle and a long lower shadow that is at least twice the size of its body. The long lower wick shows that sellers pushed the price significantly lower during the trading session, but buyers stepped in aggressively and pushed the price back up before the candle closed.
Although the Hammer Pattern is considered a bullish reversal signal, traders should always wait for confirmation from the next candle before entering a trade. Combining the hammer with support zones, volume analysis, and technical indicators can significantly improve the probability of success.
Types of Hammer Candlestick Patterns
There are two important hammer-type candlestick patterns:
Bullish Hammer
The Bullish Hammer appears after a downtrend and indicates that buyers are gaining strength. It signals a potential bullish reversal.
Bearish Hanging Man
The Bearish Hanging Man appears after an uptrend and indicates increasing selling pressure. It signals a potential bearish reversal.
Although both candles have the same shape, their meaning depends entirely on the existing market trend.
Hammer Candle Psychology
Understanding the psychology behind the hammer candle helps traders make better trading decisions.
Bullish Hammer Psychology
Sellers initially dominate the market.
Prices fall sharply during the session.
Buyers step in near support.
Buyers completely absorb the selling pressure.
The candle closes near its high.
Buyers gain confidence, increasing the probability of an upward move.
Bearish Hanging Man Psychology
Buyers control the uptrend.
Sellers suddenly enter the market.
Prices fall sharply during the session.
Buyers recover some losses before the close.
The long lower shadow reveals hidden selling pressure.
If the next candle closes lower, a bearish reversal becomes more likely.
How to Identify a Valid Hammer Candle
A high-quality hammer pattern usually has the following characteristics:
✔ Small real body
✔ Long lower shadow (at least twice the body)
✔ Very small or no upper shadow
✔ Appears after a clear trend
✔ Forms near important support or resistance
✔ Higher trading volume strengthens the signal
✔ Confirmation from the next candle
Bullish Hammer Candle Pattern
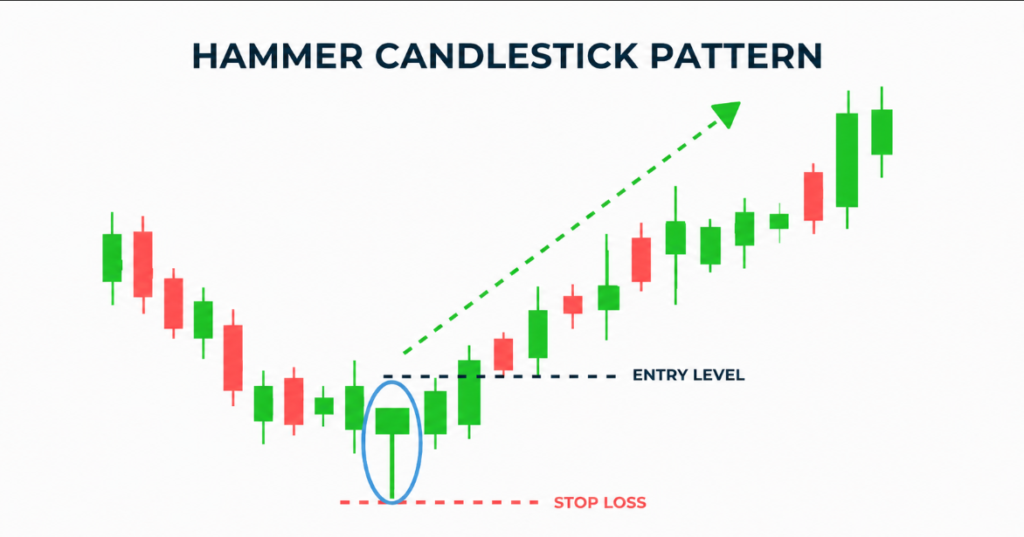
The Bullish Hammer Pattern is a strong bullish reversal candlestick pattern that appears after a downtrend. It consists of a small candle body near the top with a long lower shadow, showing that sellers pushed prices lower but buyers regained control before the candle closed.
This pattern shows that buyers have taken control from sellers, and the market may move upward.
Key Highlights
✔ Appears after a downtrend
✔ Strong buying pressure
✔ Signals potential trend reversal
✔ Best used near support zones
Entry
Buy after the bullish hammer candle closes or when the next candle breaks its high.
Stop Loss
Below the low of the hammer candle.
Bearish Hanging Man Candle Pattern
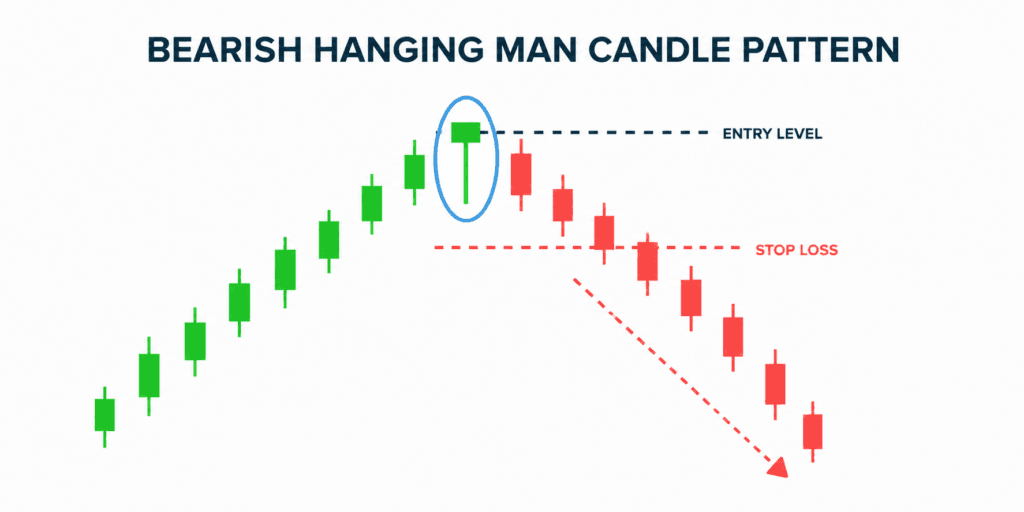
The Bearish Hanging Man Pattern is a powerful bearish reversal candlestick pattern that appears after an uptrend. It consists of a small candle body near the top with a long lower shadow, indicating that sellers are beginning to enter the market despite the ongoing uptrend.
This pattern indicates growing selling pressure and suggests that sellers may dominate the market.
Key Highlights
✔ Appears after an uptrend
✔ Strong selling pressure
✔ Signals potential downside reversal
✔ Best used near resistance zones
Entry
Sell after the hanging man candle closes or when the next candle breaks its low.
Stop Loss
Above the high of the hanging man candle.
Professional traders widely use both hammer patterns for identifying high-probability reversal setups in price action trading.
Hammer Candlestick Trading Strategy
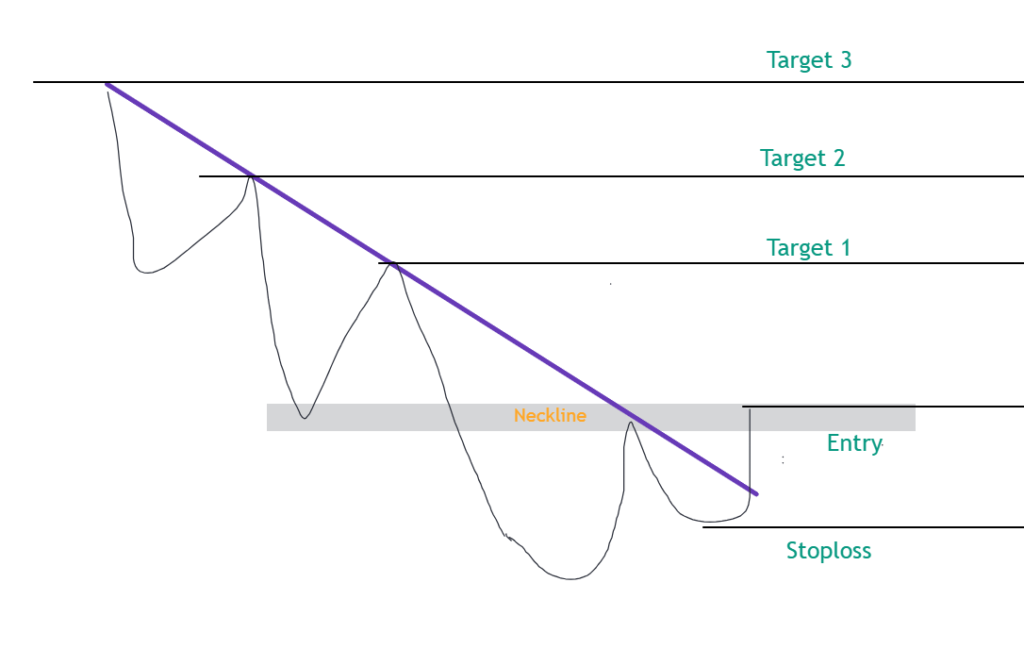
Head and Shoulders Pattern with Bullish Hammer Candle Confirmation
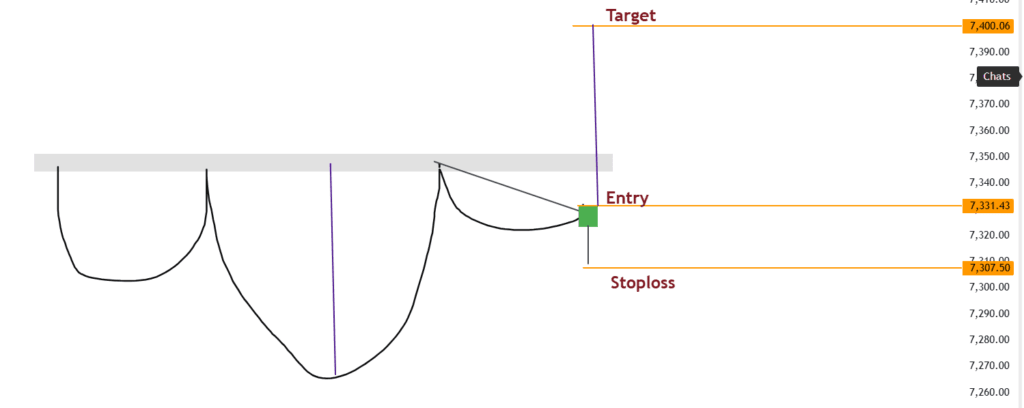
The Head and Shoulders Pattern is a powerful bullish reversal pattern that signals a potential trend reversal from bearish to bullish. In this setup, the bullish hammer candle provides strong confirmation for a buying opportunity after the neckline retest.
Entry Strategy
A buy entry is taken when the price retests the neckline support area and forms a strong bullish hammer candle. This confirms that buyers are defending the breakout level and gaining market control.
Entry Confirmation
✔ Neckline breakout occurs
✔ Price retests the neckline
✔ Bullish hammer candle forms
✔ Buy above the high of the hammer candle
This confirmation helps traders avoid false breakouts and increases trade probability.
Stop Loss
The stop loss should be placed below the low of the bullish hammer candle or slightly below the neckline support zone.
Target Strategy
The target is usually calculated using the measured move method.
Target Methods
✔ Previous resistance level
✔ Head to neckline measured move
✔ Minimum 1:2 Risk-Reward Ratio
Traders can also use a trailing stop loss to maximize profits during strong bullish momentum.
Why This Setup Works
This strategy combines:
✔ Breakout confirmation
✔ Retest confirmation
✔ Bullish hammer candle psychology
The bullish hammer candle confirms that buyers have taken control after the retest, making the setup more reliable for swing and intraday trading.
Pro Tip
The strongest trades occur when:
✔ Volume increases during a breakout
✔ Bullish hammer candle closes strongly
✔ Higher timeframe trend supports the setup
✔ RSI shows bullish momentum
Professional price action traders widely use this setup for high-probability bullish reversal trades.
Head and Shoulders Pattern with Bearish Hanging Man Candle Confirmation
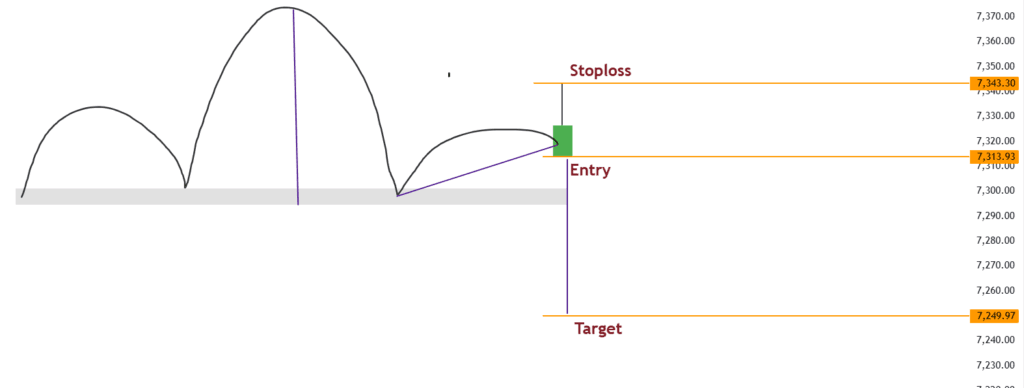
The Head and Shoulders Pattern is one of the most reliable bearish reversal patterns in technical analysis. In this setup, the bearish hanging man candle confirms strong selling pressure near the neckline retest area, providing a high-probability sell opportunity.
Entry Strategy
A sell entry is taken when the price retests the neckline resistance zone and forms a strong hanging man candle. This confirms that sellers are taking control after the retest.
Entry Confirmation
✔ Head and Shoulders pattern forms
✔ Price breaks the neckline
✔ Market retests the neckline resistance
✔ Hanging man candle appears
✔ Enter sell below the low of the hanging man candle
Stop Loss
The stop loss should be placed above the high of the hanging man candle or above the neckline resistance area.
Target Strategy
✔ Previous support level
✔ Head to neckline measured move
✔ Minimum 1:2 Risk-Reward Ratio
Why This Setup Works
This strategy combines:
✔ Market structure
✔ Neckline breakdown confirmation
✔ Retest confirmation
✔ Hanging man candle psychology
The hanging man candle confirms strong seller dominance after the retest, making the setup highly effective for intraday and swing trading.
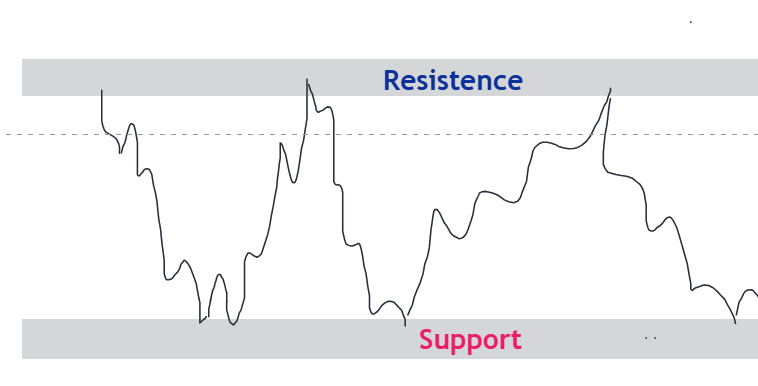
Double Bottom Pattern with Bullish Hammer Candle Confirmation
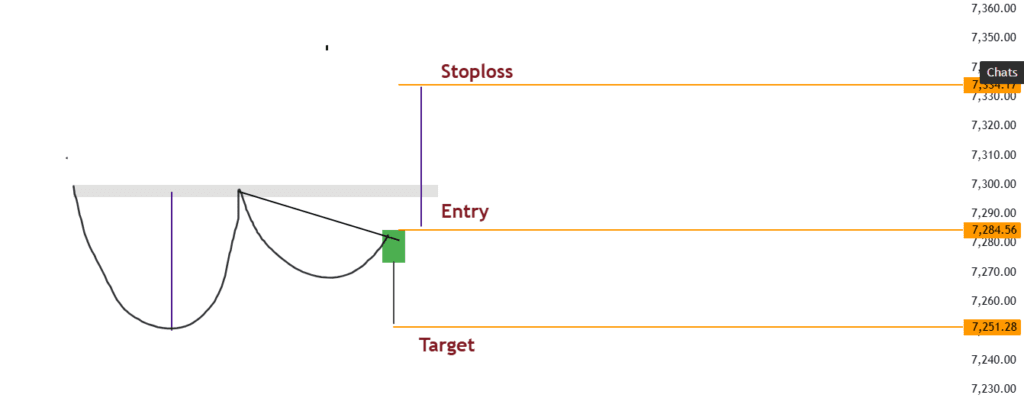
The Double Bottom Pattern is a strong bullish reversal pattern that appears after a downtrend. It indicates that sellers are losing momentum and buyers are starting to take control of the market.
In this setup, the bullish hammer candle acts as a confirmation signal near the support zone, providing a high-probability buying opportunity.
Entry Strategy
A buy entry is taken when the price forms a double bottom structure and a bullish hammer candle appears near the neckline or support retest area.
Entry Confirmation
✔ Double Bottom pattern forms
✔ Price respects the support zone
✔ A bullish hammer candle appears
✔ Enter buy above the high of the hammer candle
Stop Loss
The stop loss should be placed below the low of the bullish hammer candle or below the support area.
Target Strategy
✔ Previous resistance level
✔ Double Bottom measured move
✔ Minimum 1:2 Risk-Reward Ratio
Why This Setup Works
This strategy combines:
✔ Double Bottom market structure
✔ Strong support confirmation
✔ Bullish hammer candle psychology
✔ Price action confirmation
The bullish hammer candle confirms that buyers have gained strength after the support reaction, increasing the probability of a bullish reversal.
Double Top Pattern with Bearish Hanging Man Candle Confirmation
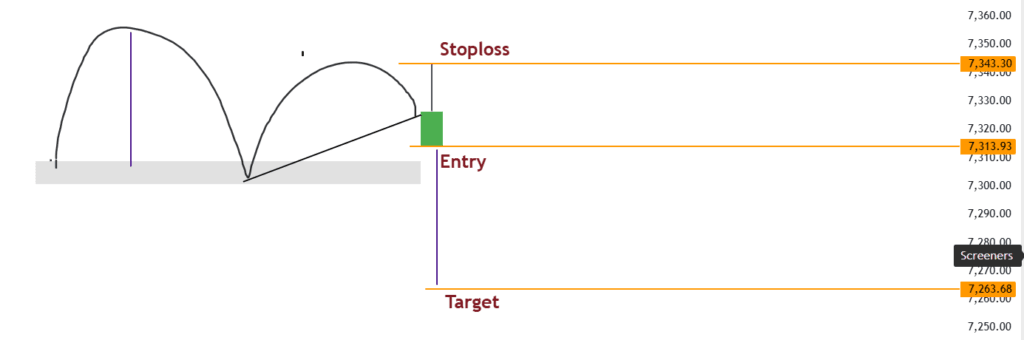
The Double Top Pattern is one of the most reliable bearish reversal patterns in technical analysis. It usually forms after an uptrend and signals that buyers are losing momentum while sellers are starting to dominate the market.
In this setup, the bearish hanging man candle provides strong confirmation for a sell entry near the resistance zone.
Entry Strategy
A sell entry is taken when the price forms a double top structure and a bearish hanging man candle appears near the resistance or neckline rejection area.
Entry Confirmation
✔ Double Top pattern forms
✔ Price rejects the resistance zone
✔ Bearish hanging man candle appears
✔ Enter sell below the low of the hanging man candle
Stop Loss
The stop loss should be placed above the high of the hanging man candle or above the resistance area.
Target Strategy
✔ Previous support level
✔ Double Top measured move
✔ Minimum 1:2 Risk-Reward Ratio
Why This Setup Works
This strategy combines:
✔ Double Top market structure
✔ Resistance rejection
✔ Bearish hanging man candle psychology
✔ Price action confirmation
The bearish hanging man candle confirms strong seller dominance near resistance, increasing the probability of a bearish reversal.
Best Timeframe for Hammer Trading
The Hammer Pattern works across all timeframes.
✔ 5-Minute (Scalping)
✔ 15-Minute (Intraday)
✔ 1-Hour (Day Trading)
✔ 4-Hour (Swing Trading)
✔ Daily (Positional Trading)
Higher timeframes generally produce more reliable signals.
Best Indicators to Combine with Hammer Pattern
Professional traders often combine the Hammer Pattern with:
✔ RSI
✔ MACD
✔ Volume Indicator
✔ Moving Averages
✔ Fibonacci Retracement
✔ Trendlines
✔ Support and Resistance
✔ VWAP
Common Mistakes Traders Make
❌ Trading without confirmation
❌ Ignoring market trend
❌ Entering before candle closes
❌ Ignoring support and resistance
❌ Using large position sizes
❌ Placing stop loss too close
❌ Trading in low-volume markets
Advantages of the Hammer Candlestick Pattern
✔ Easy to identify
✔ Beginner-friendly
✔ Works in stocks, forex, crypto, and commodities
✔ High reward-to-risk potential
✔ Effective with chart patterns
✔ Suitable for swing and intraday trading
Limitations of The Hammer Pattern
✔ Can produce false signals
✔ Requires confirmation
✔ Less effective in sideways markets
✔ Should not be traded alone
✔ Volume confirmation improves reliability
Risk Management Tips
✔ Risk only 1–2% of trading capital per trade.
✔ Always wait for confirmation before entering.
✔ Maintain at least a 1:2 Risk-Reward Ratio.
✔ Avoid overtrading.
✔ Follow a disciplined trading plan.
Frequently Asked Questions (FAQ)
Is the Hammer Pattern bullish?
Yes. The Bullish Hammer usually indicates a potential bullish reversal after a downtrend.
Is the Hanging Man bullish or bearish?
The Hanging Man is generally a bearish reversal pattern when it appears after an uptrend.
Can Hammer Candles fail?
Yes. No candlestick pattern is 100% accurate. Confirmation is always recommended.
Which indicator works best with the Hammer Pattern?
RSI, MACD, Volume, Moving Averages, Fibonacci Retracement, and Support & Resistance are commonly used.
Which markets can I trade using the Hammer Pattern?
The Hammer Pattern can be applied to stocks, forex, cryptocurrency, commodities, and indices.
Final Thoughts
The Hammer Candlestick Pattern is one of the most effective price action reversal patterns when used in the right market context. Whether trading a Bullish Hammer after a downtrend or a Bearish Hanging Man after an uptrend, combining the pattern with support and resistance, trend analysis, volume, and confirmation candles significantly improves reliability.
Rather than relying solely on the pattern, use it as part of a complete trading strategy that includes proper risk management, confirmation signals, and disciplined execution. When applied correctly, the Hammer Pattern can become a valuable tool for identifying high-probability reversal opportunities in both swing and intraday trading.